
Figure 3.
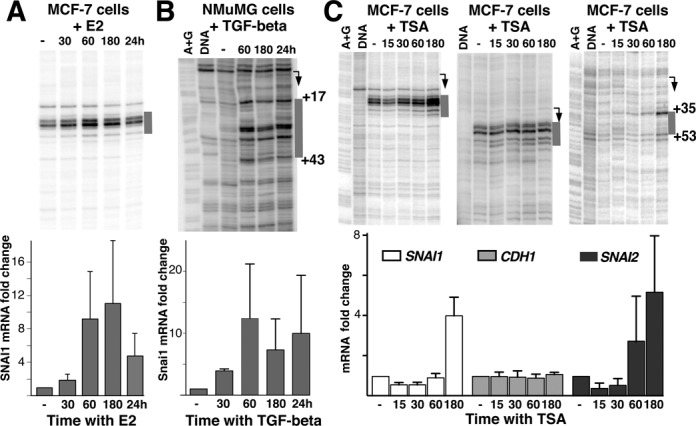
Pol II pausing signal is increased with gene activation. (A) MCF-7 cells treated with E2 and probed with permanganate footprinting (top) and RT-qPCR to detect mRNA (bottom). Time of treatment is indicated in minutes unless indicated otherwise. RT-PCR represents an average of four independent replicates. (B) Mouse NMuMG cells treated with TGF-beta. RT-PCR and permanganate footprinting represents an average of three independent replicates. (C) MCF-7 cells treated with TSA. RT-PCR represents an average of four independent replicates. The regions of permanganate reactivity emerging during activation of mouse Snai1 and human SNAI2 genes are shown alongside the gel in gray.