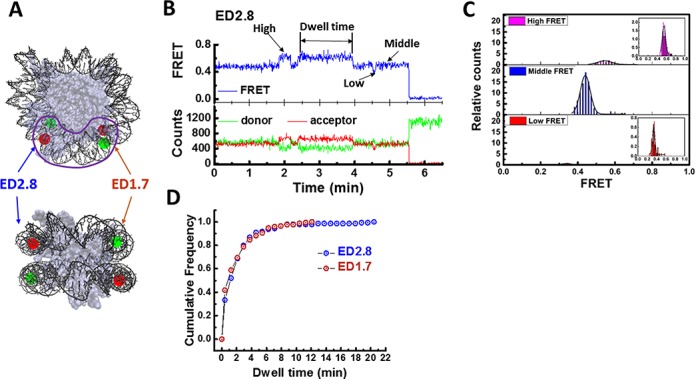
Figure 1.

Slow spontaneous conformational switching of single nucleosome. (A) Fluorescent labeling scheme (front view and side view): Cy3 (green dot) and Cy5 (red dot) are attached on the two turns of the nucleosomal DNA (Crystal structure: 3MVD). Slow conformation switching occurs in the region marked by the purple line. (B) Single molecule time traces of donor intensity (green), acceptor intensity (red) and calculated FRET efficiency (blue) show spontaneous switching between three FRET levels. (C) Normalized FRET histograms of individual FRET states of ED2.8 construct. To build these histograms, we recorded FRET time traces of approximately 1000 molecules for 50 min with 0.5 s per frame. For each molecule, we extracted average of FRET at each state (high, middle and low FRET states) separately to build histogram of individual states. The total count of each histogram was normalized to its relative population (11.83%, 84.84% and 3.46% for high, middle and low FRET states, respectively). The insets of the top and the bottom panel are the room-in histograms of high and low FRET states. (D) Cumulative distribution function of the dwell time of the high FRET state at 50 mM NaCl for ED2.8 (number of dwells N = 249) and ED1.7 (N = 170) probes.
