Figure 2.

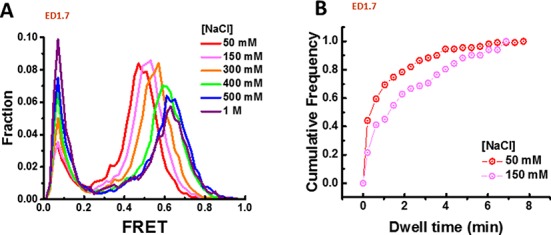
Salt-dependent kinetics. (A) FRET histogram of ED1.7 at different NaCl concentrations. (B) Cumulative distribution function of the dwell time of the high FRET state at 50 mM (number of dwells N = 170) and 150 mM (N = 140) NaCl.

Salt-dependent kinetics. (A) FRET histogram of ED1.7 at different NaCl concentrations. (B) Cumulative distribution function of the dwell time of the high FRET state at 50 mM (number of dwells N = 170) and 150 mM (N = 140) NaCl.