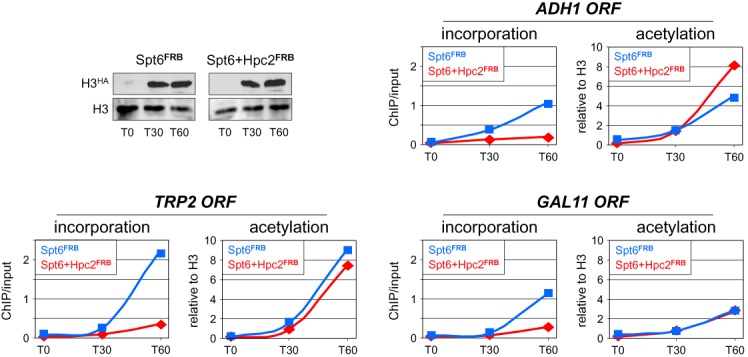
Figure 6.

Inactivation of Hpc2 blocks the increase in histone exchange but not in H3K9ac induced by Spt6 inactivation. Same time course experiment for H3HA incorporation into chromatin (left panels) and total H3K9ac levels (right panels) as in Figure 4 but under conditions where either Spt6 alone (Spt6FRB, blue lines) or Spt6 and Hpc2 (Spt6+Hpc2FRB, red lines) are depleted from the nucleus by addition of rapamycin together with galactose at T0. The ChIP values are expressed as in Figure 4. Shown on the top left is a western blot analysis using antibodies against HA or the core histone H3 to assess for galactose activation of H3HA and constant expression levels of endogenous H3 in the two strains. Total H3K9ac levels remained largely unchanged under these experimental conditions (Supplementary Figure S5D). An independent biological experiment is shown in Supplementary Figure S9.
