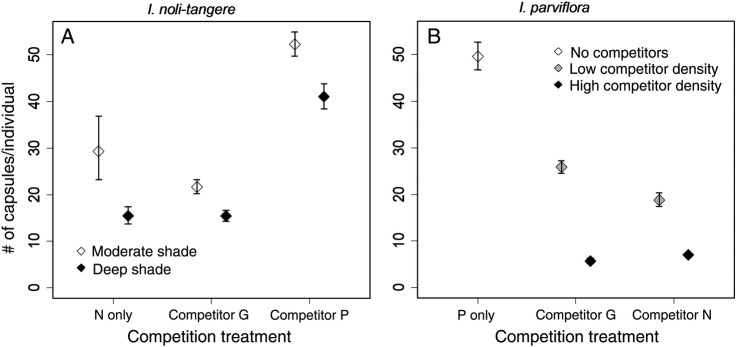
Figure 3.

(A, B) Effect of competition (competitor identity and competitor density) and environmental conditions (shading) on fecundity (number of capsules per individual). Symbols show species mean value under competition; error bars show the 95 % confidence intervals. Each graph shows the pair of most important variables (according to their explanatory power). To visualize the effect of competitor density (B), we divided this continuous variable into two categories: low competitor density = under mean competitor number and high competitor density = above mean competitor number. We omitted the graph for I. glandulifera for which no significant effects of competition were found.
