
Figure 7.
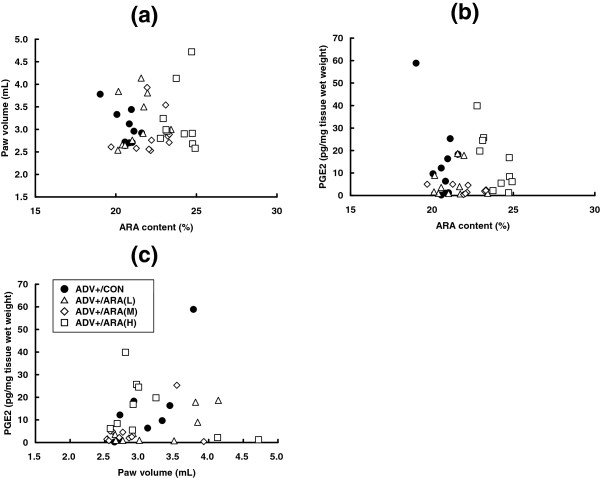
Correlation analysis. Correlation analyses were performed between the ARA content of the ipsilateral hind paw versus paw edema (disease marker) (a), PGE2 content (b), and between paw edema versus PGE2 contents (c). ●; ADV+/CON, △; ADV+/ARA(L), ◇; ADV+/ARA(M), ☐; ADV+/ARA(H).