
Figure 1.
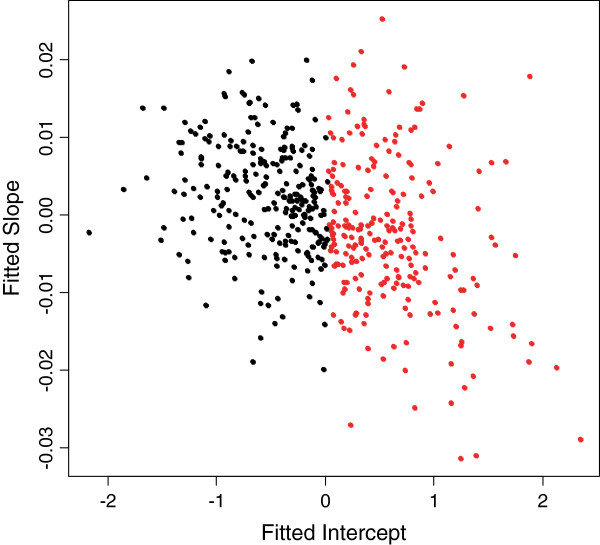
Scatterplot of fitted intercepts and slopes from the mixed effects model with MEHP regressed on gestational age.
Official websites use .gov
A
.gov website belongs to an official
government organization in the United States.
Secure .gov websites use HTTPS
A lock (
) or https:// means you've safely
connected to the .gov website. Share sensitive
information only on official, secure websites.
Scatterplot of fitted intercepts and slopes from the mixed effects model with MEHP regressed on gestational age.