. 2015 Jan 26;14:9. doi: 10.1186/1476-069X-14-9
© Chen et al.; licensee BioMed Central. 2015
This article is published under license to BioMed Central Ltd. This is an Open Access article distributed under the terms of the Creative Commons Attribution License (http://creativecommons.org/licenses/by/4.0), which permits unrestricted use, distribution, and reproduction in any medium, provided the original work is properly credited. The Creative Commons Public Domain Dedication waiver (http://creativecommons.org/publicdomain/zero/1.0/) applies to the data made available in this article, unless otherwise stated.
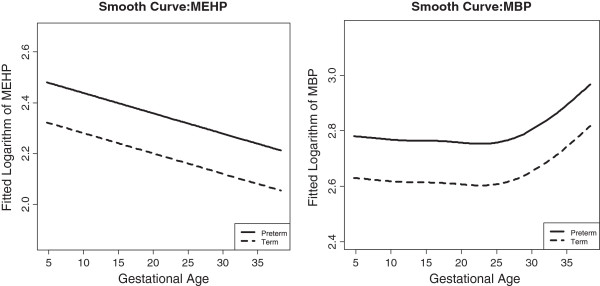
Figure 2.

Fitted smooth curves between phthalate levels and gestational age.
