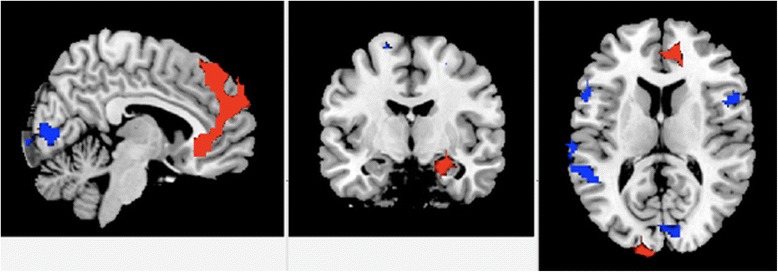
Figure 2.

Resting-state functional magnetic resonance imaging. Linear changes in resting-state functional fMRI with successive scans, Areas with reductions in connectivity to the default mode network (DMN) regions with time are shown in blue, and areas with increased connectivity to the DMNs are depicted in red.
