
Figure 8.
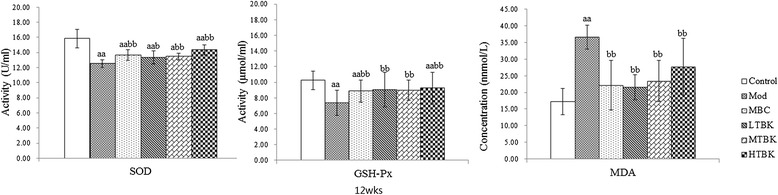
Oxidative stress parameters in each group. Each bar represents the mean ± S.E.M for ten rats. a P < 0.05, aa P < 0.01 vs. the Control group. b P < 0.05, bb P < 0.01 vs. the Mod group.
Official websites use .gov
A
.gov website belongs to an official
government organization in the United States.
Secure .gov websites use HTTPS
A lock (
) or https:// means you've safely
connected to the .gov website. Share sensitive
information only on official, secure websites.
Oxidative stress parameters in each group. Each bar represents the mean ± S.E.M for ten rats. a P < 0.05, aa P < 0.01 vs. the Control group. b P < 0.05, bb P < 0.01 vs. the Mod group.