
Figure 3.
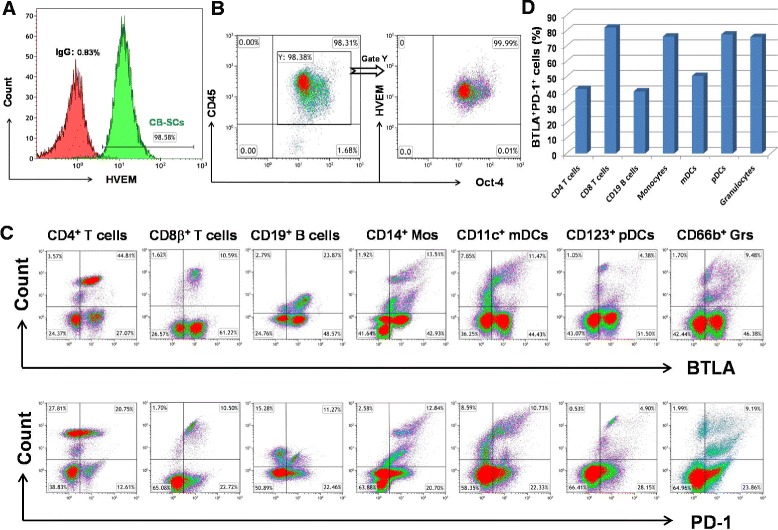
Flow cytometry analysis. (A) Expression of HVEM on CB-SCs. Isotype-matched IgG served as control. (B) Expression of HVEM on the gated CD45+Oct3/4+ CB-SCs. (C) Expression of BTLA and PD-1 on peripheral blood-derived immune cells. (D) The percentage of BTLA+ PD-1+ cells in each subpopulation. Each population was gated using the specific surface markers as described in Methods.