
Figure 1.
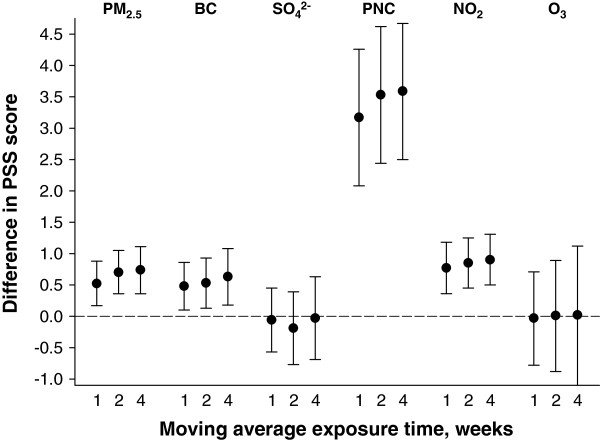
Adjusted difference in PSS score per interquartile range increase in moving average air pollution exposure measured from stationary monitors. Associations were estimated in linear mixed effect regression with random intercept for participant after adjustment for seasonality, weekday of visit, 24-hour mean apparent temperature, age, race, years of education, use of anti-depressant medication, and physical activity. Abbreviations: PSS – 14-item Perceived Stress Scale; PM2.5 –particulate matter with an aerodynamic diameter of <2.5 μm; BC – black carbon; NO2 – nitrogen dioxide; O3 – ozone; PNC – particle number counts; SO4 2- - sulfate.