
Figure 4.
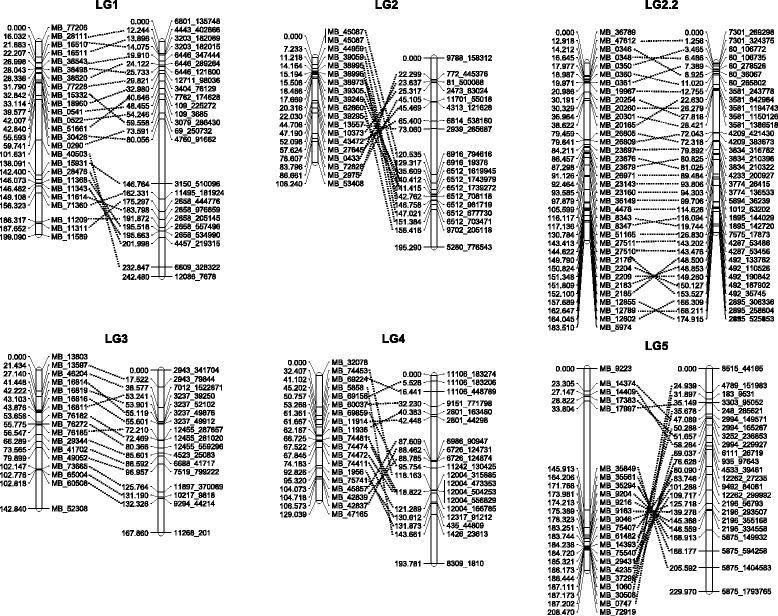
Anchor markers showing co-linearity between different cassava genetic maps. Markers with the same genomic position (determined by the corresponding scaffolds) are connected by lines. Comparison was carried out employing the genetic map reported by Rabbi et al [10].