
Figure 2.
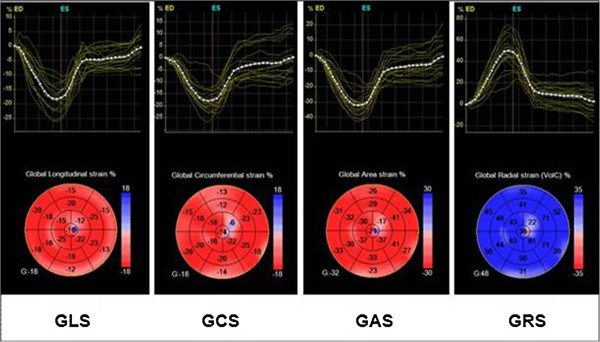
Both strain curves and a color-coded 17-segment bull’s eye plot were presented. Color lines indicate regional strain; white dotted line means global (average) strain. Values of longitudinal strain, circumferential strain, and area strain are negative (sign -), whereas values of radial strain are positive (sign +). GAS indicates global area strain; GCS, global circumferential strain; GLS, global longitudinal strain; GRS, global radial strain.