
Figure 4.
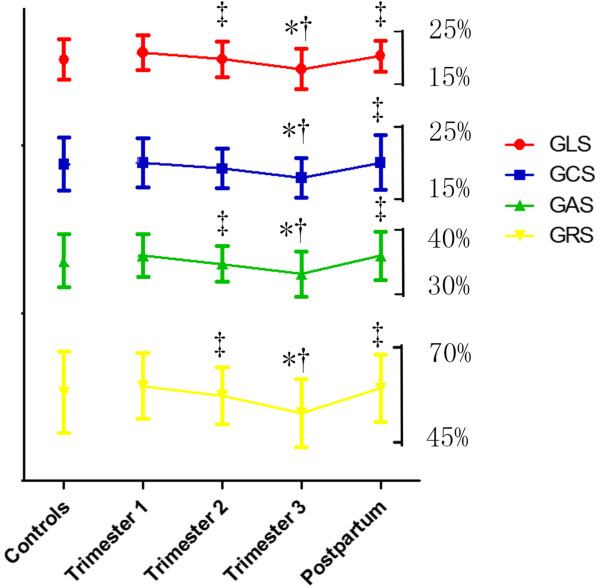
Assessment of myocardial deformation during pregnancy and postpartum by 3D STE. Data are presented as mean ± SD. Note that GLS, GCS, GRS and GAS decreased in Trimester 3, while returned in postpartum. GLS indicates global longitudinal strain; GCS, global circumferential strain; GAS, global area strain; GRS, global radial strain. *P < 0.05 vs. Controls; †P < 0.05 vs. Trimester 1; ‡P < 0.05 vs. Trimester 3; §P < 0.05 vs. Postpartum.