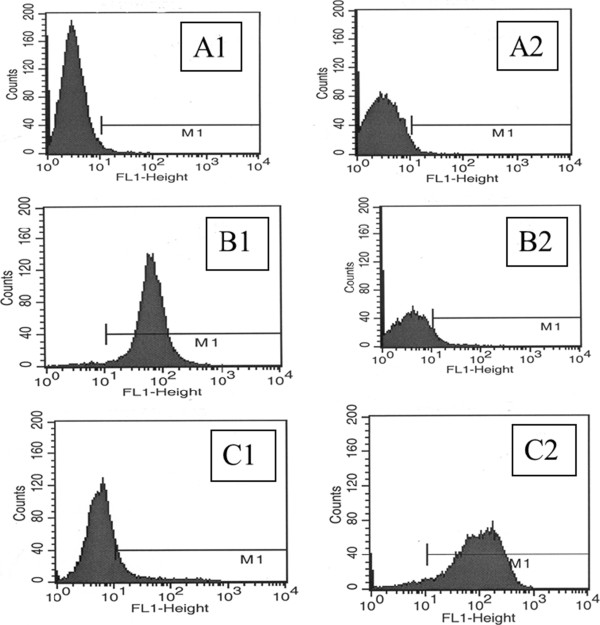
Figure 5.

Detailed analysis of CD20 expression in residual tumor cells following treatment of animals with rituximab. A1 – Isotype control for CD 20; A2 – Isotype control for anti-rituximab (anti-C2B8); B1– CD 20, untreated animal (positive expression); B2 – Anti-C2B8, untreated animal (negative expression); C1– CD 20, RTX-treated animal (negative expression); C2 – Anti-C2B8 in RTX-treated animal (positive expression).
