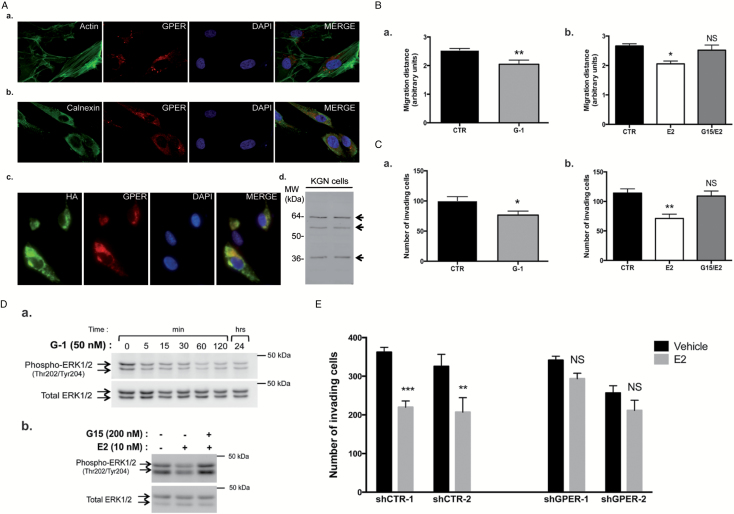
Figure 5.
E2 mediates its action in metastatic granulosa cells via the GPER1 signaling pathway. (A) GPER1 expression in KGN cells. (a) Confocal immunofluorescence studies of GPER1 (red) with staining of the filamentous actin by phalloidin-fluorescein isothiocyanate (green) and of the nuclei with DAPI. In (b), double immunostaining of an endoplasmic reticulum (ER) marker, of calnexin (red) and of GPER1 (green). (c) Immunofluorescence studies on transiently transfected KGN cells expressing HA-GPER1 performed with antibodies against HA (green) and GPER1 (red, Sigma). In (d), western blot assays on two different samples of whole cell lysates performed with the LS4271 antibody. (B) Bi-dimensional horizontal migration assays of KGN cells treated for 24h with either (a) the GPER1 agonist G-1 (50nM) or (b) E2 preceded by pretreatment with the GPER1 antagonist G15 (200nM) for 1h. CTR, control (DMSO). Shown are the means ± SEM of the migration distance, determined as described in Materials and methods. (C) Matrigel invasion assays of KGN cells treated for 4.5h with the vehicle (CTR: DMSO) and either (a) the GPER1 agonist G-1 (50nM) or (b) pretreated with the GPER1 antagonist G15 (200nM) prior to E2 treatment (10nM). Shown are the means of the number of invading cells/field ± SEM, as described in Materials and methods. (D) Western blot assay of phospho- and total ERK1/2 levels in KGN cells, (a) at different time after G-1 treatment and (b) after a 1-h pretreatment with G15 followed by a 5-min E2 incubation. (E) Matrigel invasion assays of stable KGN cell lines wherein GPER1 is silenced by shRNAs. Two negative control (shCTR) and two shGPER1 clones were treated with the vehicle (CTR: DMSO) or with E2 (10nM) for 4.5h. Shown are the means of the number of invading cells/field ± SEM, as described in Materials and methods. *P < 0.05 versus control, **P < 0.01 versus control, ***P < 0.001 versus control; NS, not significant.

