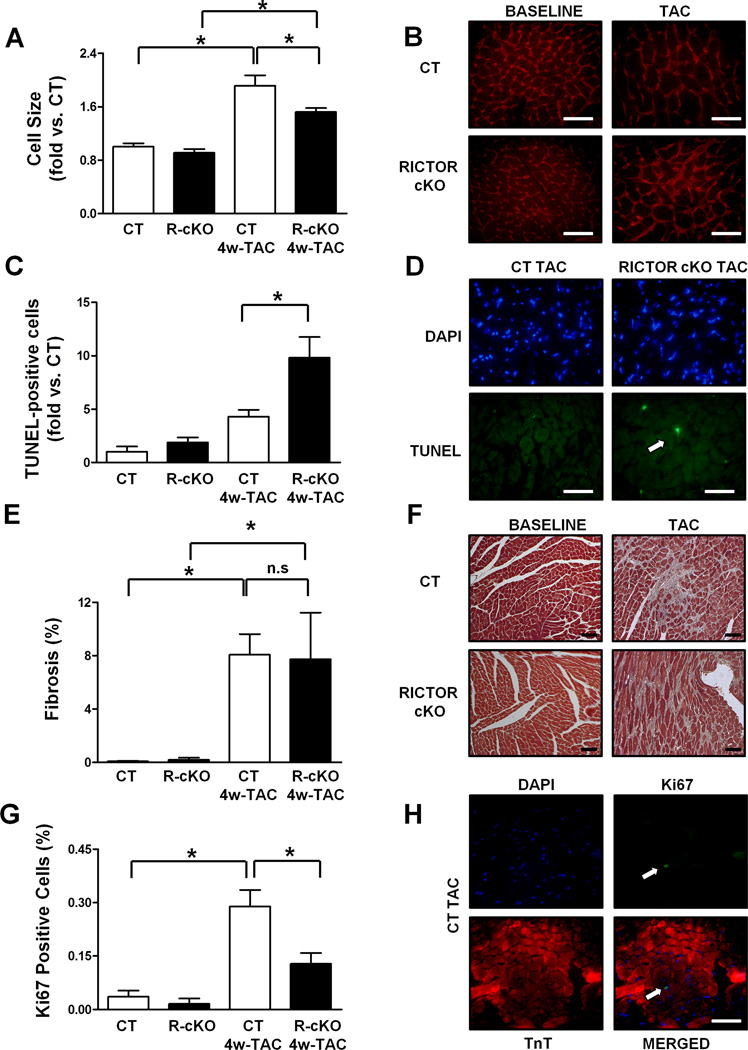
Figure 3. Rictor/mTORC2 disruption impairs left ventricular growth and promotes apoptosis in response to pressure overload.
Wheat germ agglutinin, TUNEL, Masson’s trichrome and Ki67 stainings were performed in left ventricular sections from CT and R-cKO mice at baseline and after 4 weeks of pressure overload. Representative pictures are shown (B, D, F, H). Cell size (A), percentage of TUNEL-positive cells (C), percentage of fibrosis (E) and percentage of Ki67-positive cells (G) were measured. N=3–5. All data are expressed as mean ± SEM and as fold vs. CT when specified. * p<0.05. Scale bar= 100 µm.

