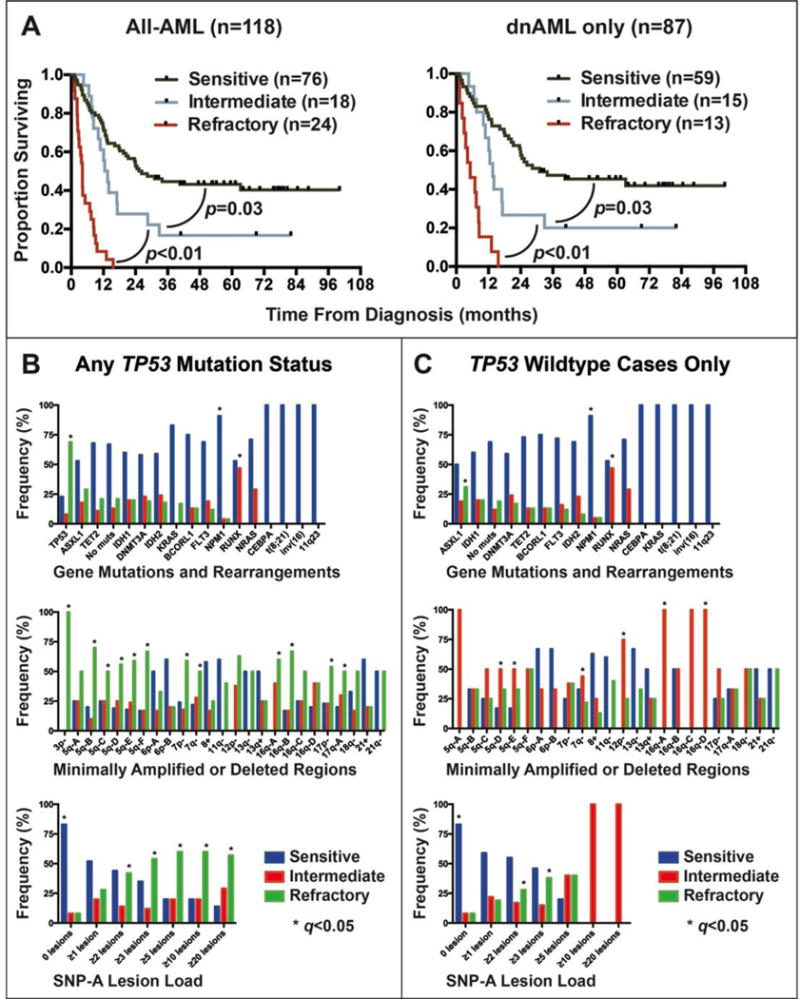
Figure 3. Genomic lesion associations with response to induction chemotherapy.

Univariate analysis of median overall survival in the MI-All-AML (N=156) and MI-dnAML (N=103) subgroups based on type of response to therapy (A). Frequency of gene mutations and structural genomic aberrations, minimally amplified or deleted regions, and aCNA/cnLOH load stratified by response to treatment in (B) all cases or in (C) TP53 wildtype cases only.
