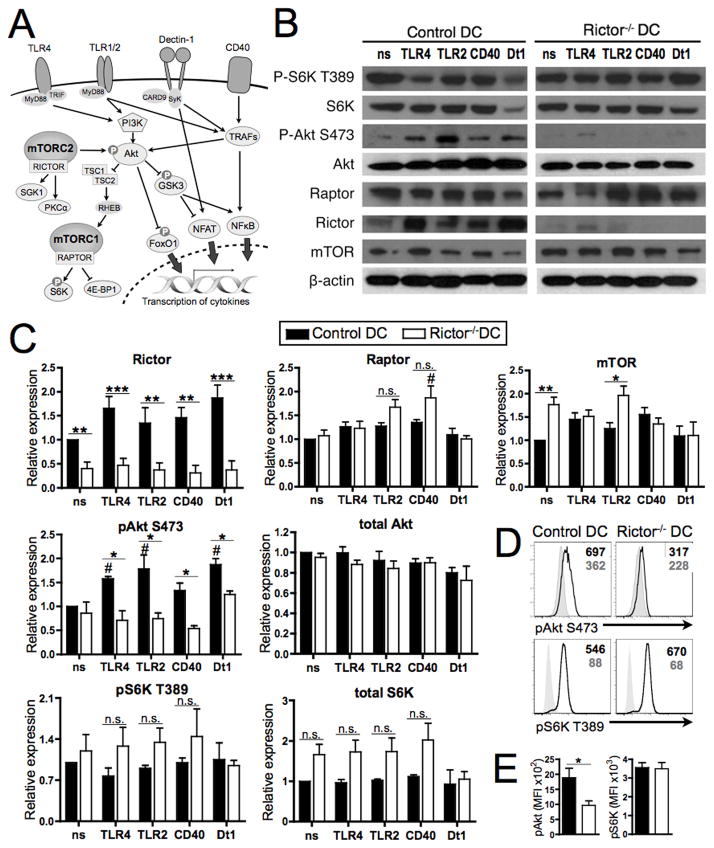
FIGURE 1. Rictor−/− DC show absence of mTORC2 signaling while maintaining mTORC1 signaling.
(A) Functions of mTORC1 and mTORC2 in relation to DC activation via TLR, Dectin-1 and CD40. Upon TLR, Dectin-1 or CD40 activation, PI3K or different TRAFs are recruited, leading to Akt activation, which is effected by mTORC2-mediated Ser473 phosphorylation. Active Akt inhibits the TCS2/1 complex, allowing activation of mTORC1, which in turn phosphorylates and activates S6K and 4E-BP1. Active Akt also inhibits GSK-3 and FoxO1 function, which translates to regulation of cytokine transcription. Dectin-1 and CD40 signal through different TRAFs, which can activate Akt, and regulate cytokine transcription via NFAT and NFκB. TSC1/2 = tuberous sclerosis 1/2; Rheb = Ras homolog enriched in brain; S6K = ribosomal protein S6 kinase; 4E-BP1 = eukaryotic initiation factor 4E-binding protein 1; SGK1 = glucocorticoid inducible kinase-1; PKC = protein kinase C; FOXO1 = forkhead box O 1; GSK3 = glycogen-synthase-kinase-3; TRAF = TNF receptor-associated factor. (B) BM-DC were generated from WT or Rictor−/− mice and cultured in the absence (non-stimulated; ns) or presence of LPS (TLR4), LTA (TLR2), CD40 ligand (CD40) or Curdlan (Dectin 1; Dt1) for 18h, then re-stimulated with the same agents for 30 min before obtaining cell lysates. Total lysates were immunoblotted for the indicated protein. Data are representative of n = 3 to 4 independent experiments. (C) All proteins shown were quantified relative to non-stimulated control DC and normalized to β-actin. (D) Phosphorylation levels of Akt S473 and S6K T398 (open profiles) were determined in DCs by flow cytometric analysis following CD11c+ cell purification and LPS stimulation for 1h. Filled profiles denote samples stained with secondary Ab only. Mean fluorescence intensity (MFI) for pAkt or pS6K is indicated in the top right corners. Plots are representative of n = 5 independent experiments. (E) Mean expression of pAkt and pS6K MFI across n = 5 experiments. * P < 0.05, ** P < 0.01, *** P < 0.001 compared to control DC, and # P < 0.05 compared to the respective non-stimulated condition.

