
Figure 8. VDR and class I HDAC expression levels in human adenomas and adjacent normal colonic tissue.
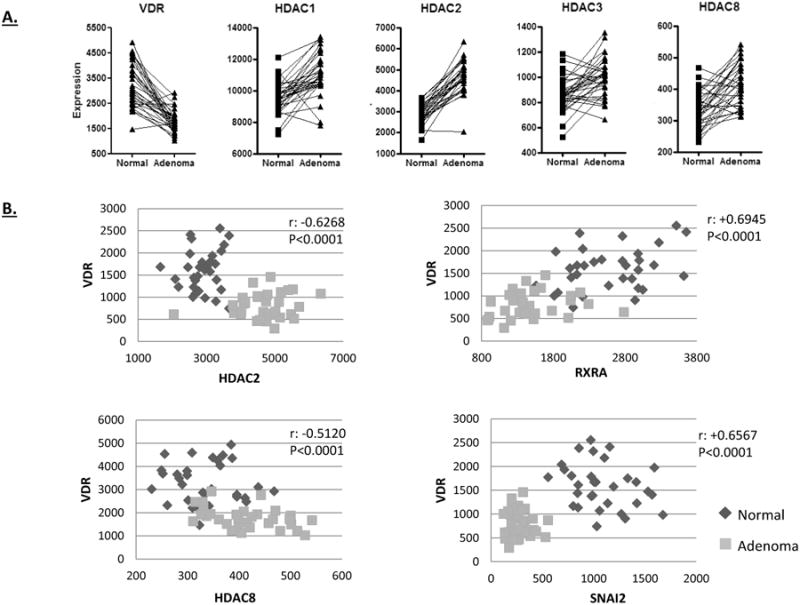
A) Data from the NCBI GEO database (GDS2947) was downloaded and plotted to show VDR and HDAC expression in the matched samples. A significant down-regulation in VDR expression was observed in the adenomas, which is in contrast to the up-regulation of the class I HDACs (p<0.0001). B) VDR expression negatively correlated with HDAC2 and HDAC8 expression, and positively correlated with RXRA and SNAI2/SLUG in human adenomas. Correlations were signficant as determined by Pearson, with the p values indicated on the graphs.