
Figure 2. RNA-Seq of atrial samples from sinus rhythm (SR) and paroxysmal AF (pAF) patients.
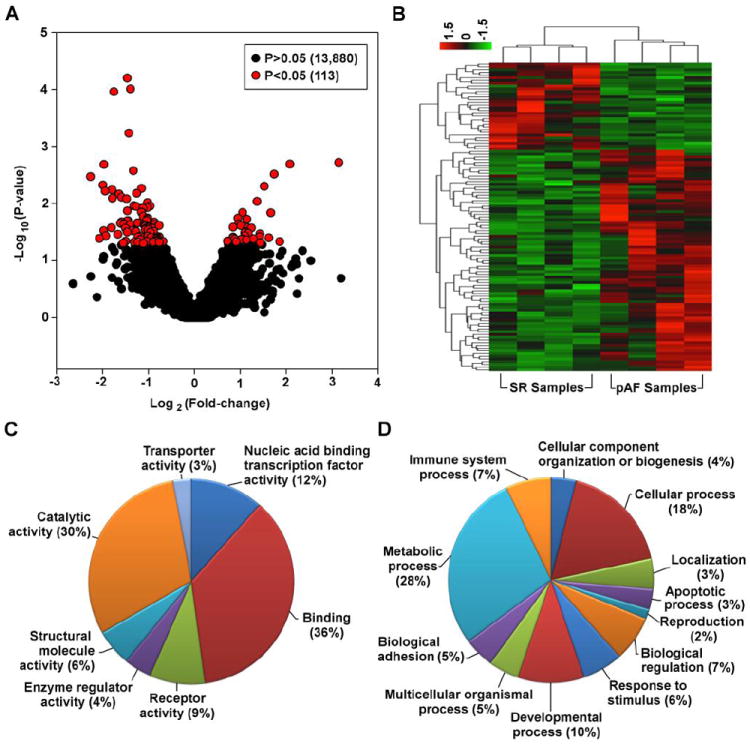
A. Volcano plot of all the transcripts detected by RNA-Seq highlighting the 113 transcripts that are differentially expressed between SR and pAF samples (red circles). B. Heat-map of the 113 differentially expressed transcripts. Gene ontology pie charts of the differentially expressed transcripts based on the “Molecular Function” (C) and “Biological Process” (D) categories.