
Figure 3. miRNA microarray of atrial samples from sinus rhythm (SR) and paroxysmal AF (pAF) patients.
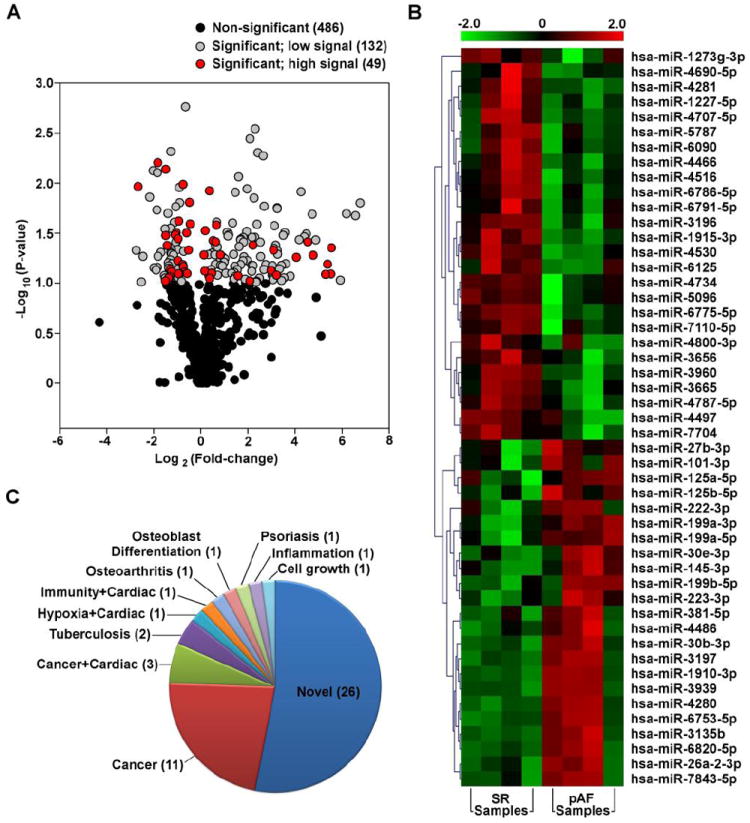
A. Volcano plot of all the miRNAs detected by microarray highlighting the 49 miRNAs that are both differentially expressed between SR and pAF samples and have a high signal on the microarray (red circles). B. Heat-map of the 49 differentially expressed miRNAs. C. Pie chart showing known roles of the differentially expressed miRNAs. “Novel” means no known function has been established for the miRNAs.