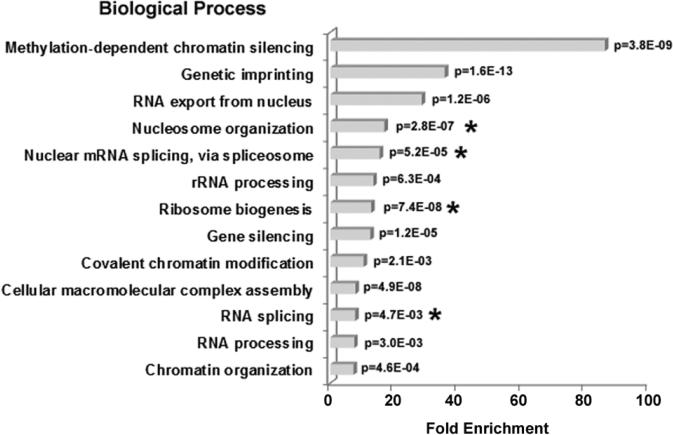
Fig. 5.
GO Biological process enrichment in proteins altered in H1ΔTKO mESC. The bar graph shows the fold enrichment of GO biological processes terms in the H1-depleted dataset relative to the Mus musculus database using the DAVID Bioinformatics Resources functional annotation clustering algorithm (31). The most highly enriched functions were chosen from a cluster of similar terms. A p-value for each term is indicated. Asterisks (*) indicated terms shared with the H1-binding proteins identified in T-cells (Fig. 2.).

