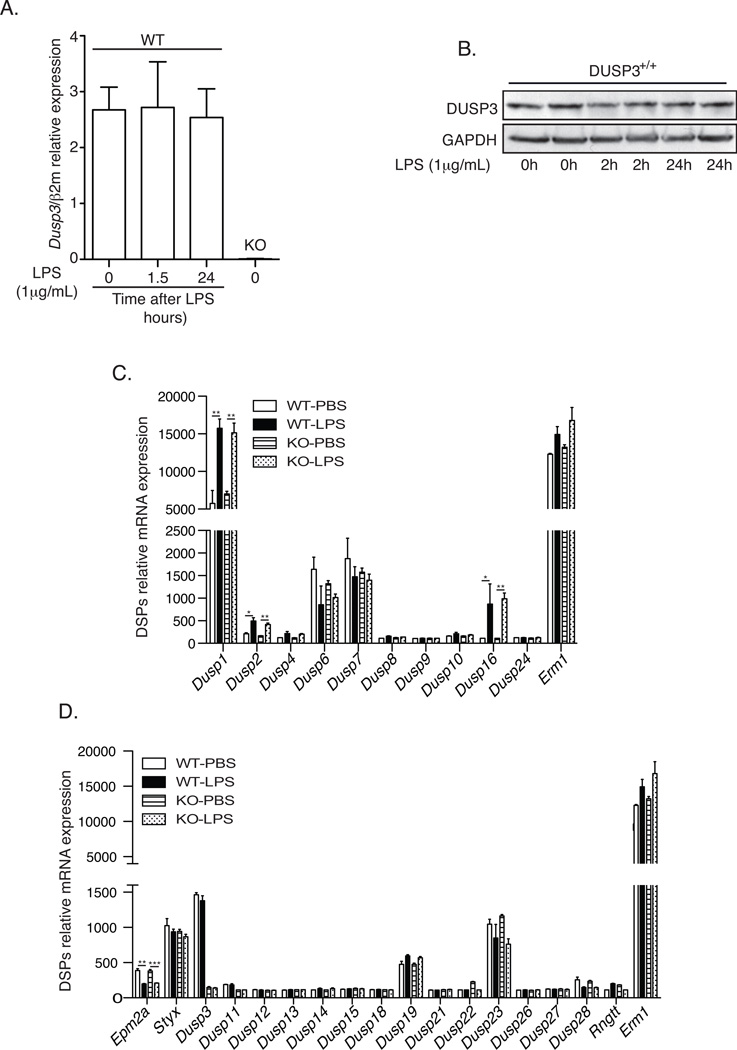
Figure 8. DUSP3 deletion does no affect other DSPs expression.
(A–B) PMs isolated from 10–12 weeks old DUSP3+/+ and DUSP3−/− mice were stimulated ex vivo with 1µg/mL of LPS for the indicated time points. (A) qRT-PCR was performed to quantify the expression of Dusp3 gene. The expression was relative to beta macroglobulin (β2M). n=3 mice in each experimental group. (C–D) Total RNA was isolated from peritoneal macrophages of DUSP3+/+ and DUSP3−/− 36 hours after PBS or LPS (6mg/kg) injection. Gene expression profiling was performed using Illumina’s multi-sample format Mouse WG-6 V2 BeadChip. The expression of all typical DSPs (MKPs) (C) and atypical (D) are shown. Erm1 (F4/80) was used as positive control for macrophages expressed mRNA. Data are presented as mean ± SEM of the fluorescence intensity for the DSP probe of interest. N= 3 mice in each group. *, p<0,05, **, p<0,01, ***, p<0,001 determined using unpaired t-test.

