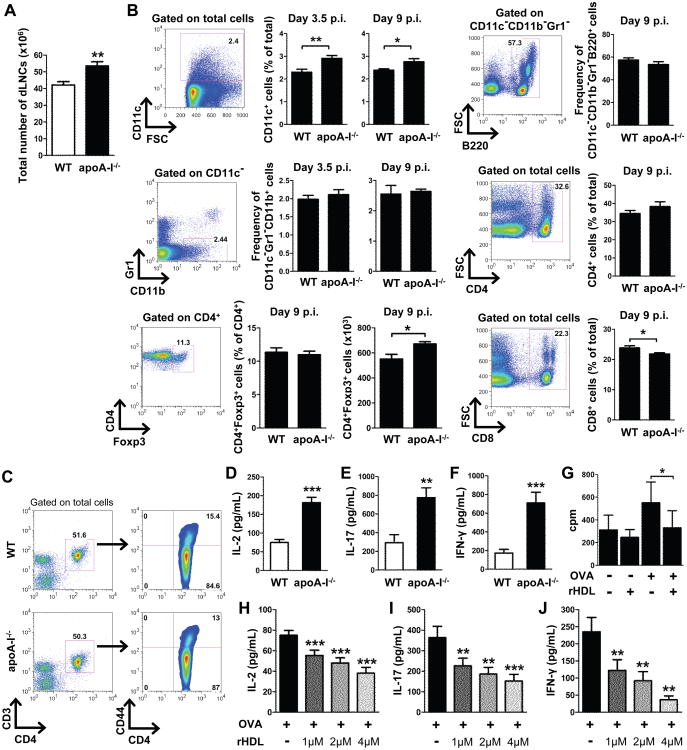
Figure 4.
OVA-specific Th1 and Th17 immune responses are modulated by HDL. (A) LN cellularity in WT and apoA-I mice (n=12-13/group) 9 days after OVA immunization (**p=0.0018). Results are expressed as mean ± SEM; data are combined of five independent experiments.(B) dLNCs from WT and apoA-I-/- mice (n=4-6/group) were collected 3.5 and 9 days post OVA immunization (p.i.). Gating strategy and frequencies or absolute numbers of CD11c+ DCs, B220+ B cells, CD11b+ macrophages, CD4+ and CD8+ T cells and Foxp3+ Tregs are shown. Numbers on the gates denote frequencies. Results are expressed as mean ± SEM. (C) Flow cytometric analysis of OVA-primed dLNCs from WT and apoA-I-/-- mice (n=6/group) after in vitro re-stimulation with 15 μg/mL OVA for 48 h. Gates were set as indicated. Data are representative of three independent experiments. (D-F) Levels of IL-2 (***p<0.0001), IL-17 (**p=0.0055) and IFN-γ (***p=0.0008) in culture supernatants of OVA-primed dLNCs are shown (n=6-7/group). Results are expressed as mean ± SEM; data are combined of at least four independent experiments. (G) OVA-primed dLNCs from WT mice (n=3/group) were re-stimulated with OVA (15 μg/mL) in vitro in the presence of rHDL (1 μM) for 72 h and then pulsed with 1 μCi [3H]thymidine for 18 h. The incorporated radioactivity was measured. Results are expressed as mean ± SEM. (H-J), dLNCs from OVA-immunized WT mice (n=6-8/group) were cultured with increasing concentrations of rHDL in the presence of OVA (15 μg/mL). Levels of IL-2 (***p≤0.0004), IL-17 (**p=0.001, ***p=0.0006) and IFN-γ (**p≤0.0081) were determined in culture supernatants 48 h later. Results are expressed as mean ± SEM; data are combined of at least three independent experiments.

