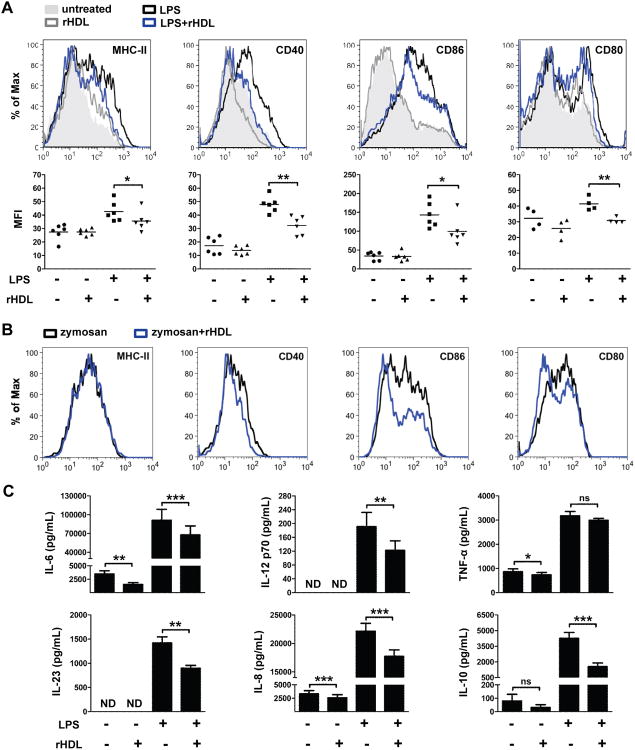
Figure 6.
rHDL prevents activation and maturation of BMDCs. BMDCs from WTmice (n=2-6) were stimulated with LPS (0.5 μg/mL) or zymosan (20 μg/mL) and treated with 4 μM rHDL for 18 h. (A) Expression levels of MHC-II (*p=0.026), CD40 (**p=0.0076), CD86 (*p=0.0226) and CD80 (**p=0.0047) were evaluated by flow cytometry. Representative FACS histograms are shown. Gates were set on CD11c+ cells. Dot plots represent the averages of the geometric mean fluorescence intensity (MFI) of at least two independent experiments.. (B) Expression levels of MHC-II, CD40, CD86 and CD80 were evaluated by flow cytometry. Representative F ACS histograms are shown. Gates were set on CD1 1c+ cells. (C) Levels of IL-6, IL-23, IL-12 p70, IL-8, IL-10 and TNF-α in culture supernatants were measured by ELISA. Results are expressed as mean ± SEM; data are combined of three independent experiments; *p=0.0229, **p≤0.0038, ***p≤0.0008; ns; not significantly different. ND; not detectable.

