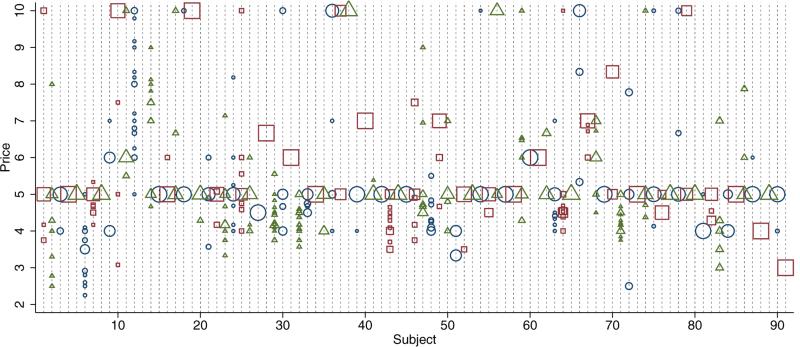
Figure 1.
Distribution of Within-Subject Prices in the IVR Data. Note: each “column” displays the distribution of prices experienced by a particular subject in the IVR data. The size of a marker indicates the frequency with which that subject experienced that price. The figure reflects the sample restrictions on the IVR data used in the analysis of the IVR data. In particular, only subjects reporting ever purchasing heroin can be included.

