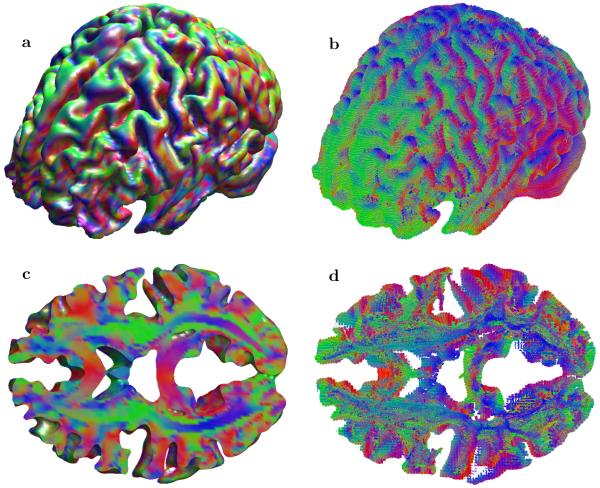
Fig. 11.
Results of full brain ESP tractography obtained using the Human Connectome Project diffusion imaging dataset (MGH 1010). Panel (a) shows anisotropy maps for primary direction of the transition probabilities for the whole volume and panel (b) shows full brain tractography also for the whole volume. Panel (c) and (d) provide detailed views of for a set of slices (46 ≤ z ≤ 51).

