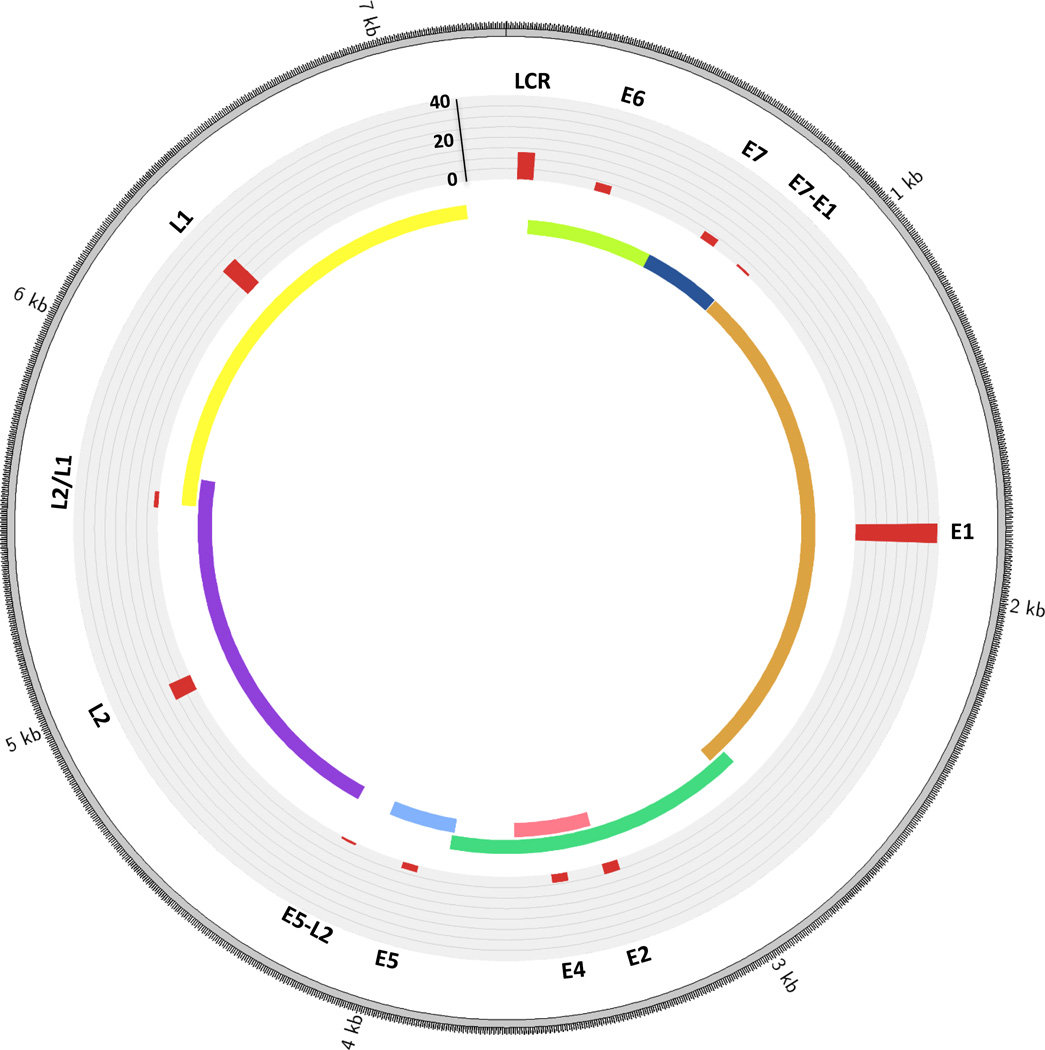
Figure 1.
Distribution of breakpoints across the HPV genome. The histogram (in red) indicates the number of tumors with a breakpoint in that particular gene. L2/L1 indicates a region of overlap between L2 and L1. E7-E1 refers to the area between the E7 and E1 genes, and likewise for E5-E2. Counts are based on data from the 25 HPV-positive HNSCC primary tumors with integrations analyzed by Parfenov et al. (22). Please note the HPV16 genome is depicted here, however three of the tumors had HPV33 and one had HPV35 (the structure of these is highly similar to HPV16).

