
FIGURE 4.
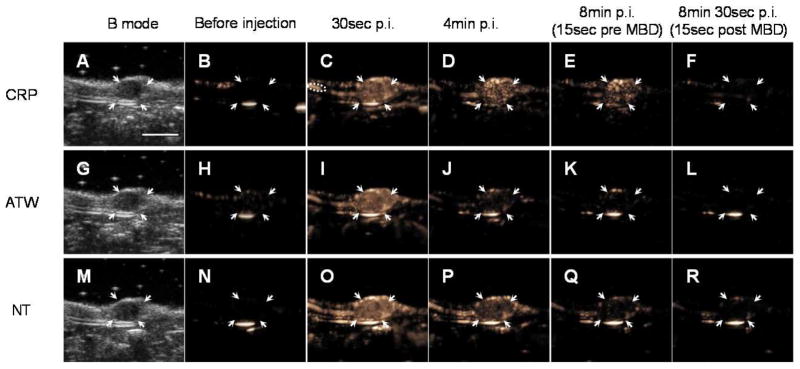
One example set of images showing the binding kinetics and blood clearance of CRP (first row, A–F), ATW (second row, G–L), and NT (third row, M–R) MBs. For each tumor, 5 × 10⁷ CRP, ATW, and NT MBs were injected consecutively with a random order. One B mode image (first column, A, G, M) was acquired before injection to define the tumor area, and 10 sec CPS clips were recorded and averaged before injection (B, H, N), 0, 0.5 (C, I, O), 1, 2, 4 (D, J, P), 6, 8 (E, K, Q), 8.25, and 8.5 (F, L, R) min after injection. MBD was applied at 8.25 min after injection. Orange pixels represent CPS enhancement (the presence of the microbubbles in the imaging plane). Regions of interest are indicated as follows: arrows indicate tumor; and dashed circle (C) indicates a nearby blood vessel used to assess MB circulation. The scale bar (A) represents 5 mm.