
Figure 8.
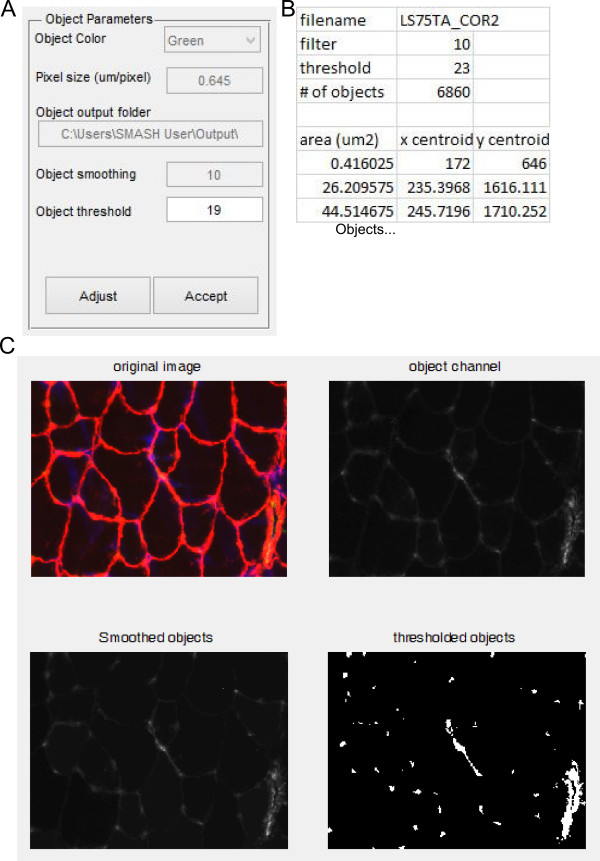
Object counter. (A) Input box with options for object counter function. (B) Truncated example of Excel output from running object counter function. (C) Portion of immunofluorescent image. Red is laminin stain, green is PECAM, and blue is DAPI (top left). Image showing only the objects of interest, here PECAM from the green channel (top right). Image showing objects of interest after smoothing filter is applied (bottom left). Binary image showing discrete objects that pass threshold value (bottom right).