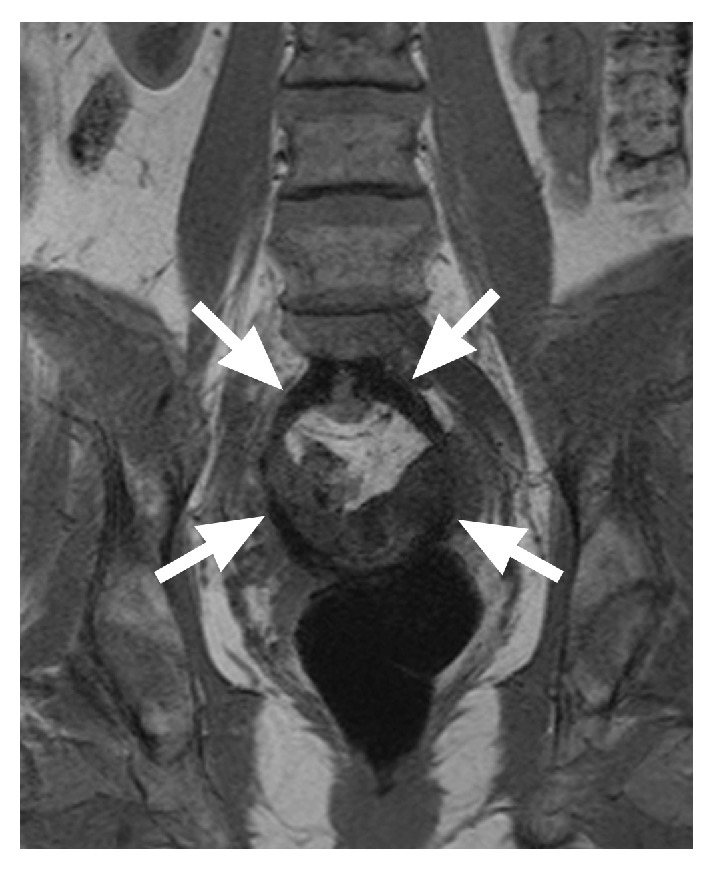
Figure 7.

Same patient as in Figure 6, this time a T1-weighted dataset, again with a coronal subvolume minimum intensity projection. Using the T1-weighted images, the contrast between the implant and the surrounding tissue is even better. Due to the iron oxide particles, a signal loss in the area of the implant is obvious (arrows), which allows for exact identification of the implant.
