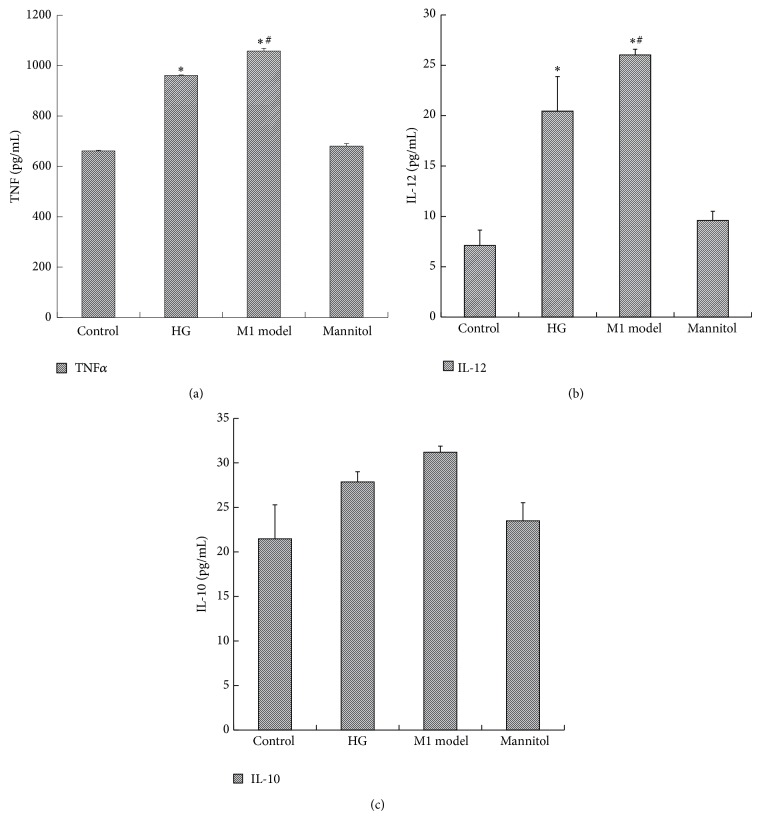
Figure 2.
The effect of high glucose on the expression of cytokines in the supernatant. RAW264.7 cells were treated with 25 mM glucose (HG) for 24 h. The supernatant was collected for ELISA assay. A concentration of 11.1 mM glucose was used as the control. The M1 model group (100 U/mL IFNγ + 5 ng/mL LPS) was used as a positive control. Data are presented as the mean ± SD (n = 3-4 per group). * P < 0.05 versus control; # P < 0.05 versus HG.

