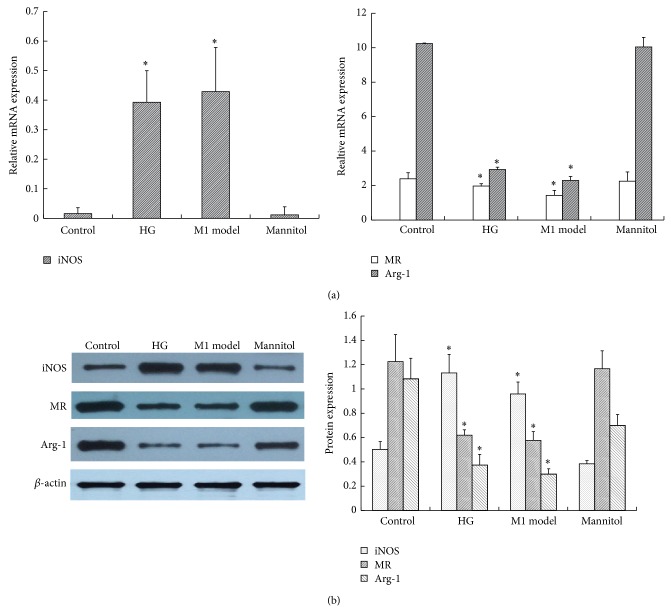
Figure 3.
The effect of high glucose on M1/M2 macrophage-specific markers. RAW264.7 cells were treated with 25 mM glucose (HG) for 24 h. The cells were collected for (a) RT-PCR and (b) western blotting analysis. β-actin was used as an internal control. A concentration of 11.1 mM glucose was used as the control. The M1 model group (100 U/mL IFNγ + 5 ng/mL LPS) was used as a positive control. Data are presented as the mean ± SD (n = 3-4 per group). * P < 0.05 versus control.

