Figure 8.

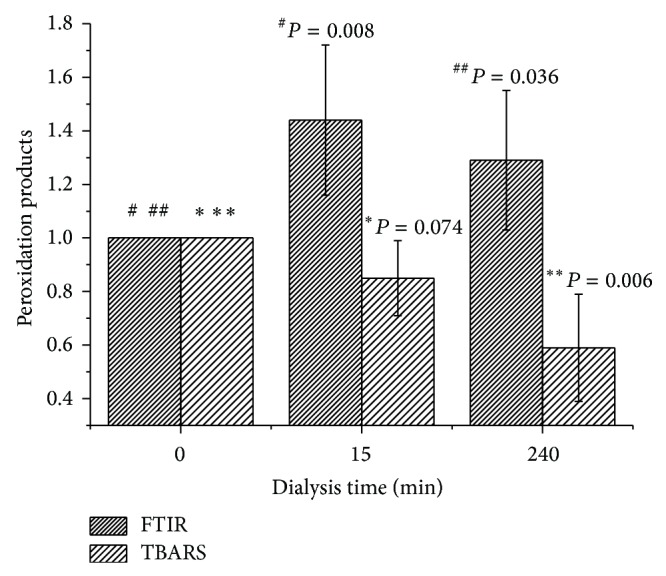
Dependence of the amount of peroxidation products relative to control sample (0 min HD) upon duration of the haemodialysis treatment determined by using FTIR-ATR spectroscopy and TBARS (N = 5).

Dependence of the amount of peroxidation products relative to control sample (0 min HD) upon duration of the haemodialysis treatment determined by using FTIR-ATR spectroscopy and TBARS (N = 5).