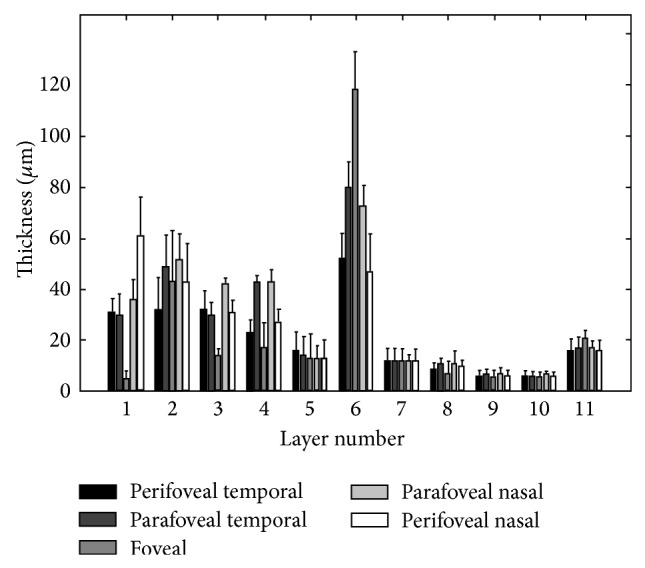
Figure 7.

Mean and standard deviation of macular sector thickness plotted as a function of retinal eccentricity for 11 retinal layers. The 11 retinal layers were the NFL (layer 1), GCL (layer 2), IPL (layer 3), INL (layer 4), OPL (layer 5), ONL + OLM + HFL (layer 6), ISL (layer 7), CL (layer 8), OSL (layer 9), VM (layer 10), and RPE/BM (layer 11).
