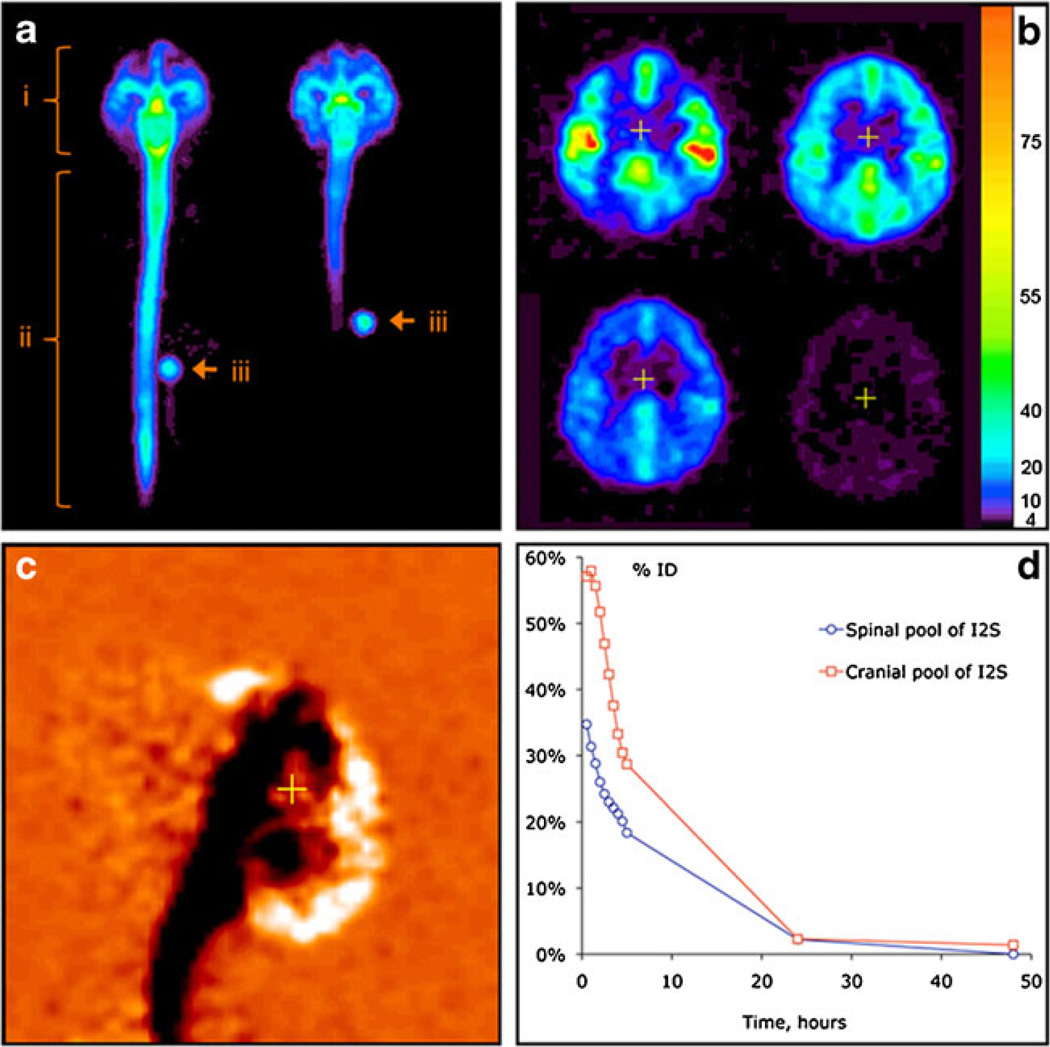
Fig. 7.
In vivo distribution of 124I-labeled I2S (3 mg/animal) in cynomolgus monkeys by PET. (a) Distribution of I2S administered through the lumbar (left) and ICV (right) catheters 30 minutes after the administration as demonstrated by a projection PET image (sum of all slices). Relative linear color scale. (b) The distribution of I2S in the brain at 0.5, 2.5, 5 and 24 hours after lumbar administration; PET image, 1.2 mm slice through the corpus callosum region in the plane parallel to the occipital bone. The color scale is calibrated in mg/ml of I2S. (c) Changes in the cerebral I2S distribution between 0.5 and 5 hours after lumbar administration shown in monochrome linear color scale. The image was obtained by subtraction of the quantitative data matrix obtained at 5 hours from the one obtained at 0.5 hours. Neutral orange color represents no change. Clearance of I2S from the CSF is seen as black, and accumulation in the parenchyma and arachnoid as white color. (d) An example of single-animal dynamics of I2S clearance from the leptomeningeal compartment and CNS [12]

