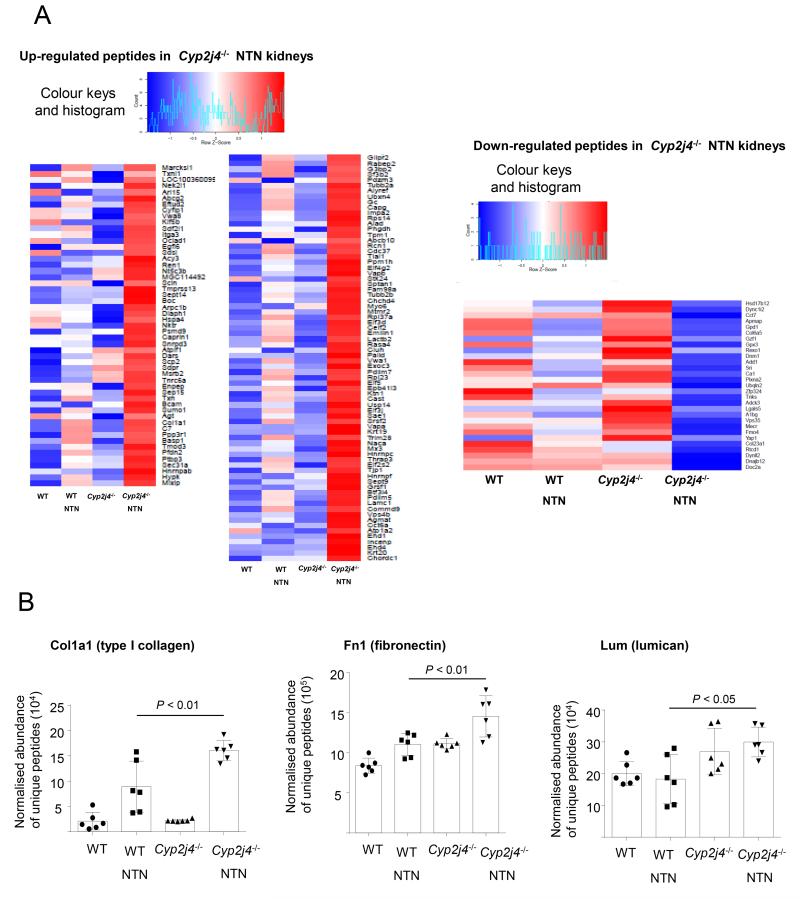
Figure 6.
Quantitative proteomics (LC-MS/MS) confirms increased ECM peptide abundance in Cyp2j4−/− nephritic kidneys. (A) Heat map showing up-regulated (left panel) and down-regulated (right panel) peptides in Cyp2j4−/− specifically under NTN (day 10) conditions (i. differentially expressed between Cyp2j4−/−-basal and -NTN but not differentially expressed between WT and WT-NTN, ii. differentially expressed between Cyp2j4−/−-NTN and WT-NTN). (B) Normalised abundance of unique peptides for Col1a1, Fn1 and Lum in WT and Cyp2j4−/− rat kidneys in basal (untreated) and under NTN conditions. Note that these 3 genes’ expression is up-regulated in Cyp2j4−/− BMDMs (Figure 3A).

