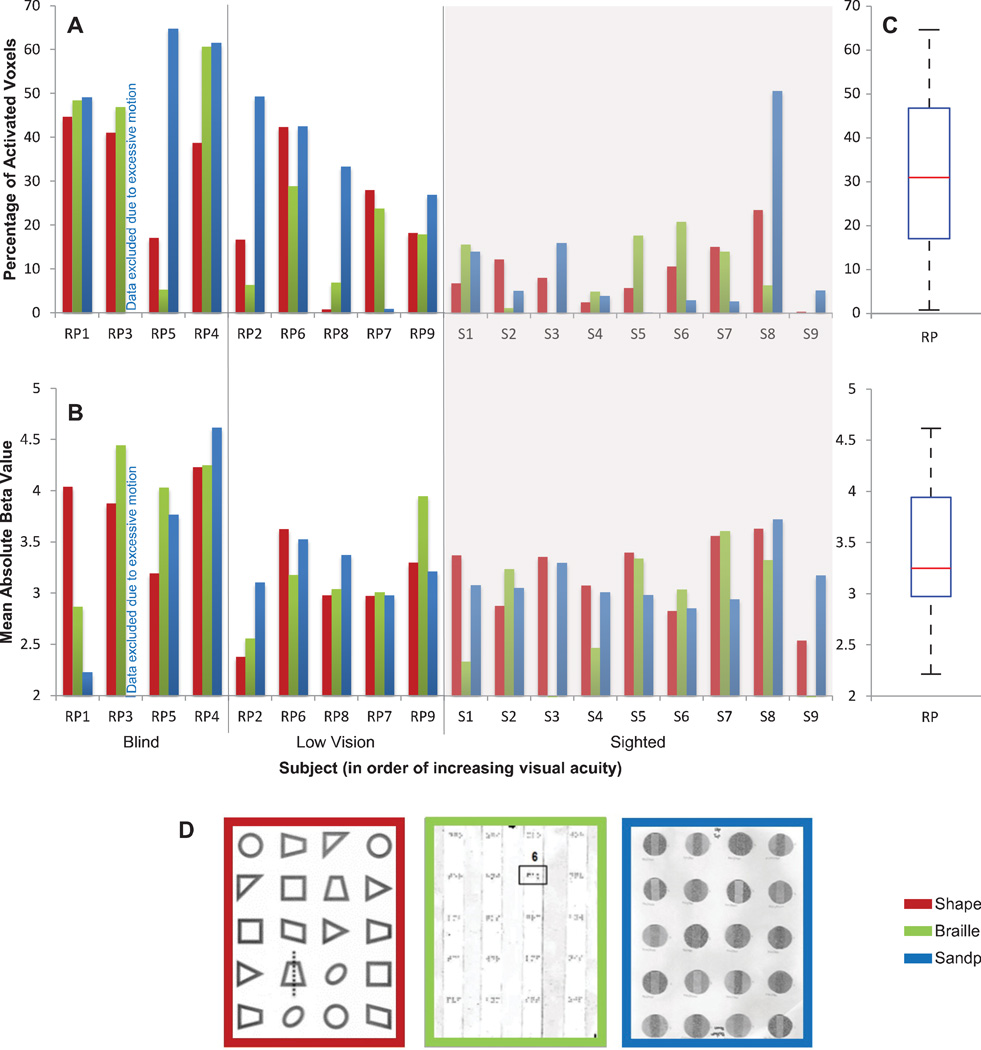
Figure 2. Extent and strength of tactile-evoked responses in V1.
A: The extent of tactile-evoked BOLD responses in V1, measured in terms of the percentage of modulated voxels (FDR < 0.05) in V1 for each subject and each task. RP subjects are ranked along the x-axis in descending order of severity of visual field loss. Sighted controls are grouped against a gray background. B: The strength of tactile-evoked BOLD responses in V1, measured in terms of mean absolute beta value of the significantly modulated V1 voxels for each subject and each task. C: Boxplots illustrating the distributions of the areal percentage (top) and mean absolute beta value (bottom) of modulated V1 voxels in RP and sighted control groups across all tasks. The red line indicates the median within each group, the edges of the boxes indicate the 25th and 75th percentiles, and the whiskers illustrate the extreme datapoints, excluding outliers (red data points). D: Example stimuli of the three tactile tasks, with shapes in red, Braille in green, and sandpaper in blue.

