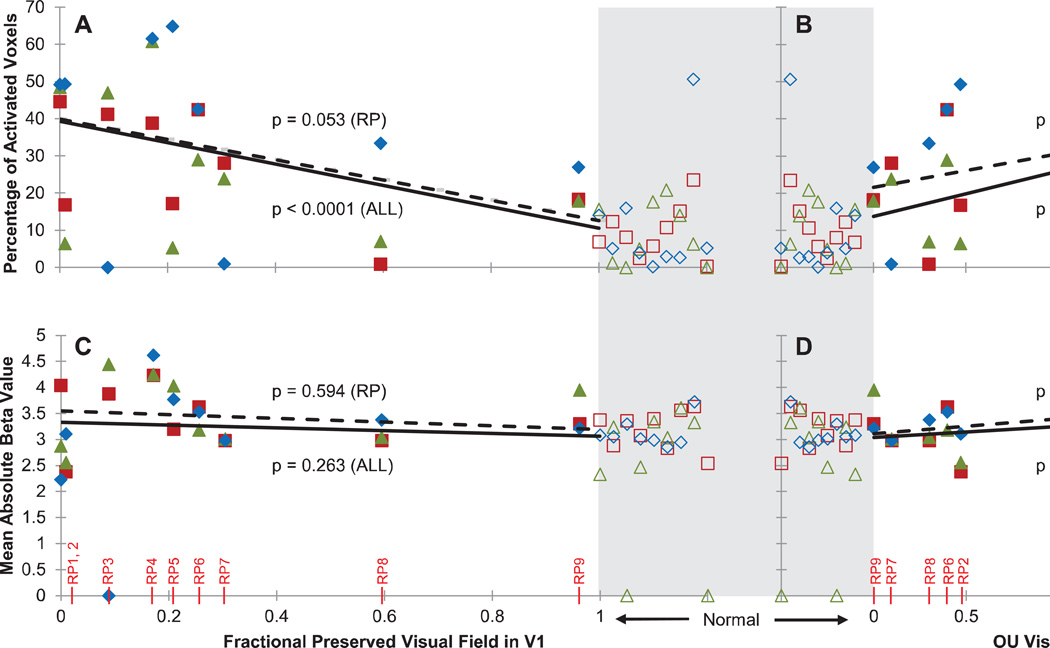
Figure 3. Predictive margins from a linear mixed effects model relating visual function to tactile-evoked responses in V1.
For each plot, the lines indicate the marginalized predicted (fixed) effect of preserved visual field (left panels) or visual acuity (right panels) by the linear mixed effects model. The observed data (for each subject and task) are overlaid. The dashed lines illustrate marginalized effects among RP subjects only (“RP”), while solid lines illustrate marginalized effects among RP and sighted subjects combined (“AH”). Statistics (p-values) above and below the lines correspond to dashed and solid lines, respectively, and indicate significance of the effect of visual function on the V1 response based on the mixed effects model. Sighted control subjects have by definition a fractional preserved visual field in V1 of 1 and average acuity of 0 logMAR, but are plotted separately (open symbols) from patient data, highlighted in gray and spread out horizontally for visualization. A: Percentage of tactile-modulated voxels in V1 (extent) versus fractional preserved visual field in V1. Fractional preserved visual field in V1 was determined by calculating the areal cortical magnification factor for spared regions of the visual field. This value was then normalized by the total V1 area. B: Percentage of modulated voxels in V1 versus visual acuity (logMAR) (subjects RP1 and RP3 were assigned a visual acuity of logMAR = 3 for analysis purposes, as these subjects’ had minimal light perception only and their acuity could not be measured). C: Mean absolute tactile-evoked BOLD modulation amplitude (strength) of modulated V1 voxels versus fractional preserved visual field in V1. D: Mean absolute BOLD amplitude of modulated V1 voxels versus visual acuity.

