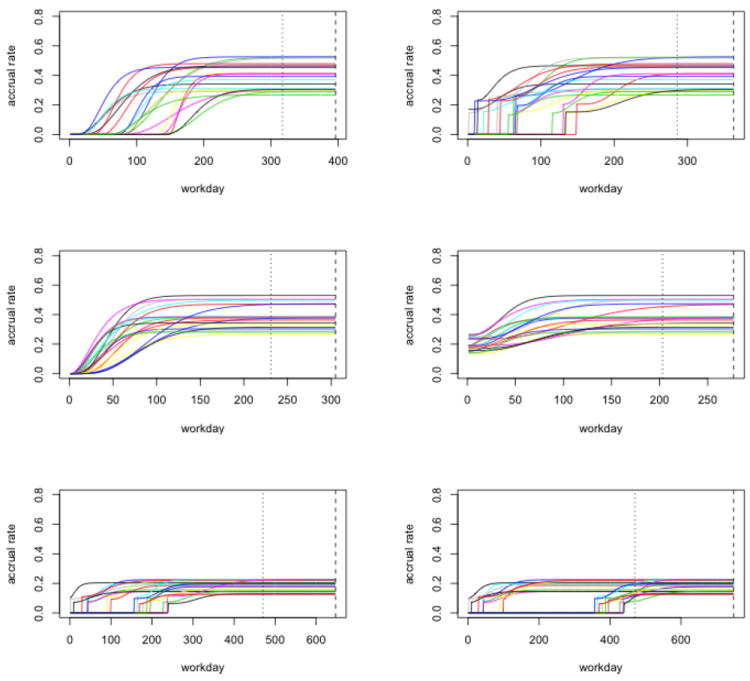
Figure 1.

Representative true accrual rates used to generate observed accrual data in the simulation studies. The dotted vertical line represents the interim look and the dashed vertical line represents the end of enrollment. The first row is for the set of simulations in which participating regions have different start-up times, with the left side for dj = 0 and the right side for dj = 0.5. The second row is for the second set of simulations in which all participating regions initialize accrual at the same time, with the left side for dj = 0 and the right side for dj = 0.5. The third row is for the third set of simulations (dj = 0.5), with the left side for interval setting 1 and the right side for interval setting 3. In addition, ρ = 0.3 and pct. = 70% for all.
