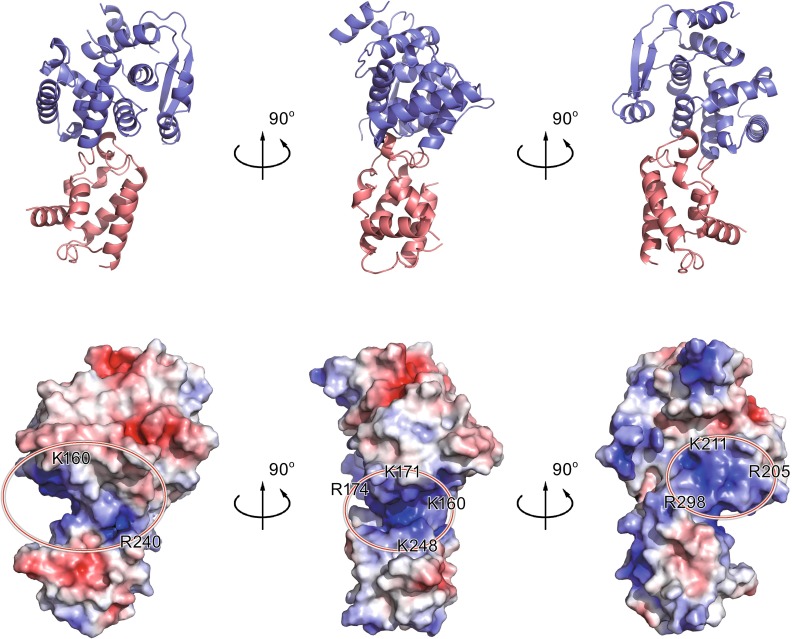
Figure 2.
Potential RNA binding region of EBOV NP core. (A) Cartoon representation of EBOV NPcore. The N-lobe and C-lobe are colored as slate blue and salmon red, respectively. (B) Electrostatic surface potential of EBOV NPcore. The electrostatic surface potential of EBOV NPcore was calculated using APBS tools, with limits ±5 kbT/ec. Positive residues are highlighted by red circle on EBOV NPcore, suggesting the presence of several positively charged grooves that may be involved in RNA binding

