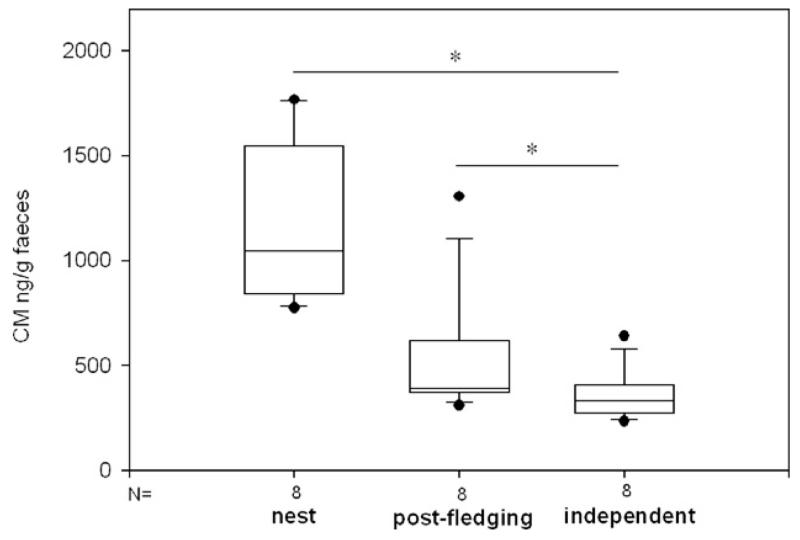
Fig. 1.
Amounts of excreted corticosterone metabolites (ng/g feces) in three developmental periods in KLF2 ravens: nest, post-fledging and when birds were independent. N=number of birds, box plots show the median and the interquartile range from the 25th to the 75th percentile. Whiskers above and below the box indicate the 10th and the 90th percentiles. Asterisks mark significant between-phase differences as determined by post hoc tests for multiple comparisons for Friedman two-way analyses of variance by ranks (*p<0.05).

