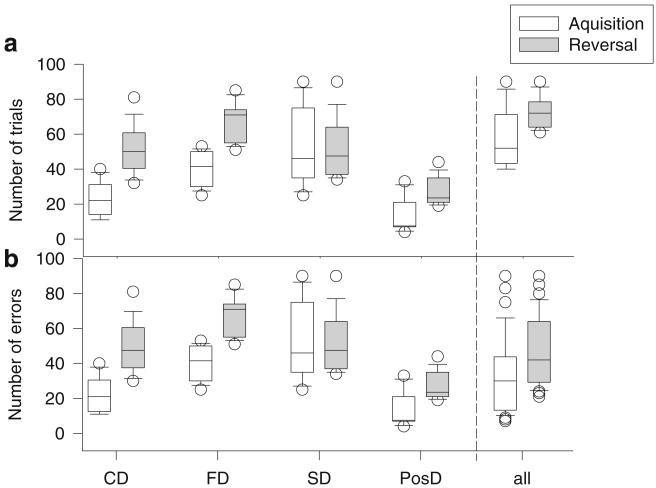
Fig. 1.
a Box plots (10th and 90th percentile) of the number of trials to reach criterion for the four discrimination tasks and overall. A lower score suggests quicker learning. b Box plots (10th and 90th percentile) of the number of errors out of total trials for the four discriminations and overall. A lower score indicates greater accuracy. CD color discrimination, FD form discrimination, SD size discrimination, PosD position discrimination, all all tasks taken together

