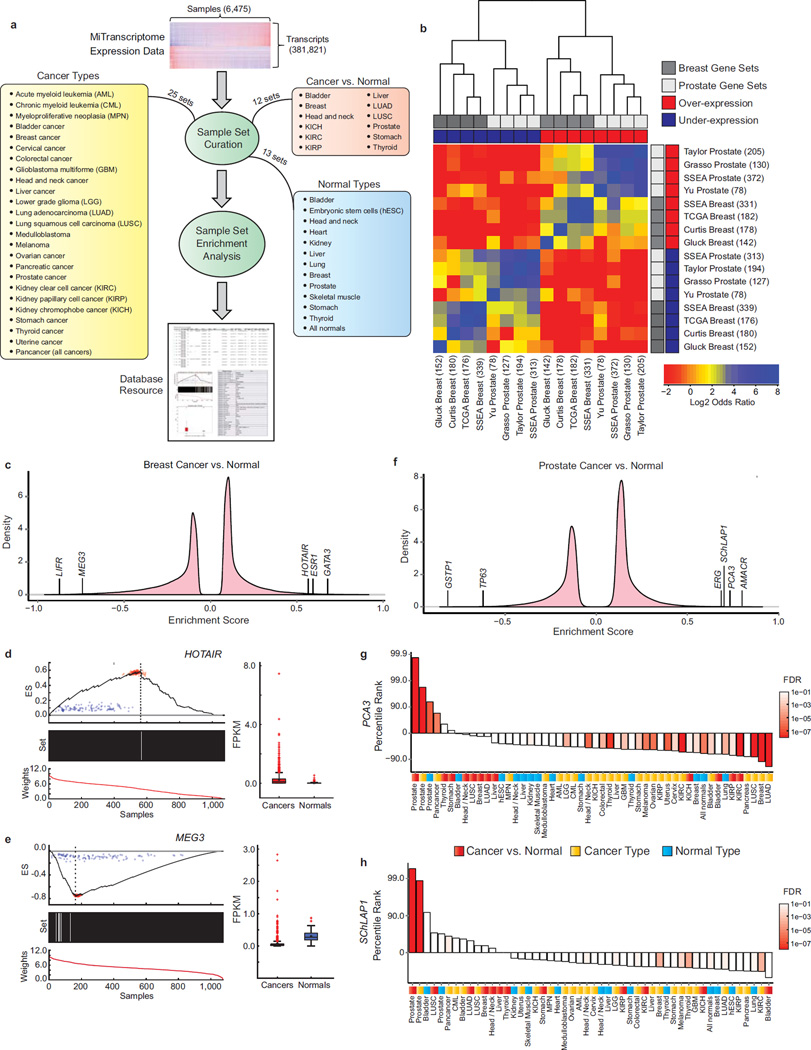
Figure 4. Methodology for discovering cancer-associated lncRNAs.
(a) Samples were grouped into 50 different sample sets in three categories: (1) cancer type, (2) normal type, and (3) cancer versus normal. Enrichment testing was performed using SSEA, and significant transcripts were imported into an online resource.
(b) Heatmap showing concordance of SSEA algorithm with prostate and breast cancer gene signatures obtained from the Oncomine database. The top 1% over-expressed and under-expressed genes from each analysis were compared using Fisher’s Exact Tests.
(c) Enrichment score density plots for breast cancers versus normal samples.
(d and e) Enrichment and expression plots for lncRNAs (d) HOTAIR and (e) MEG3. Subplots include: (top) running ES across all samples (dotted line: max/min ES, red points: Poisson resamplings of fragment counts, blue points: random permutations of the sample labels). (middle) Black bars (cancers) or white bars (normals). (bottom) Rank-ordered normalized expression values. Adjacent boxplots (interquartile range and median shown by box and whiskers) depict transcript expression (FPKM) in cancers and normals. 967 and 109 patients in the breast cancer and normal groups, respectively.
(f) Enrichment score density plots for prostate cancers versus normal samples.
(g and h) Bar plots of percentile ranks for prostate cancer-specific lncRNAs (g) PCA3 and (h) SChLAP1 across Cancer vs. Normal (red), Cancer Type (gold) and Normal Type (blue) sample sets. Bar colors depict statistical significance (FDR).

