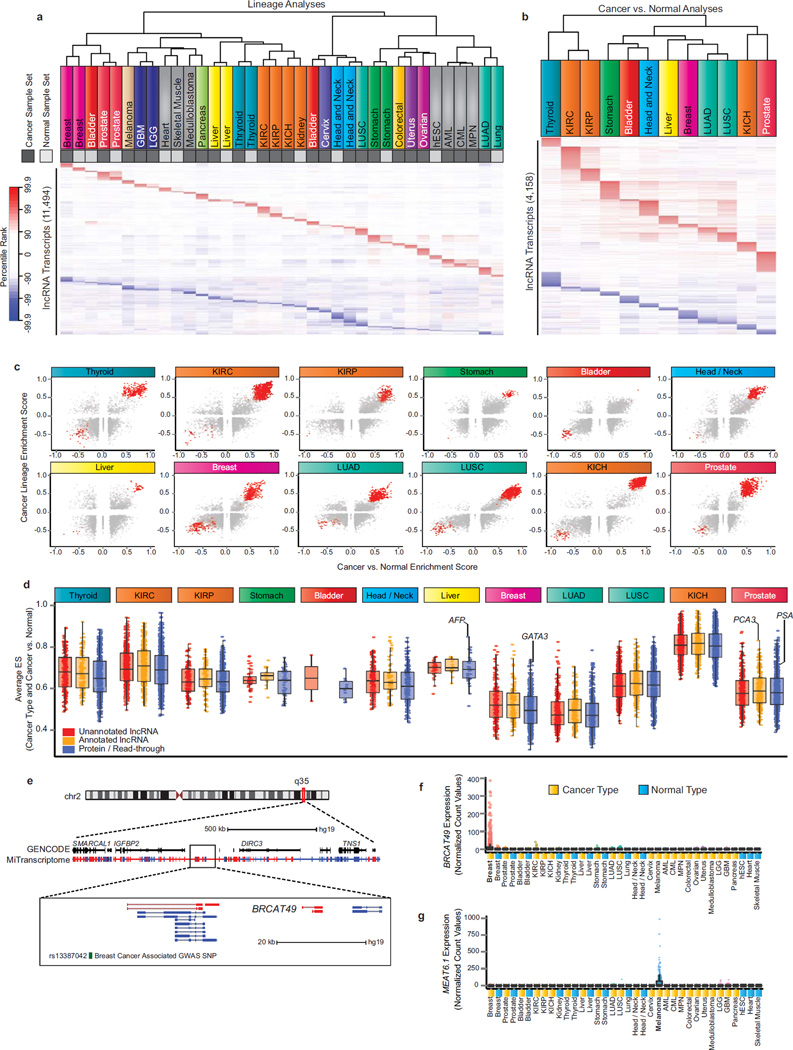
Figure 5. Discovery of lineage-associated and cancer-associated lncRNAs in the MiTranscriptome compendia.
(a) Heatmap of lineage-specific lncRNAs. Each column represents a sample set from one of 25 cancer (dark grey) and normal (light grey) lineages and each row represents an individual lncRNA transcript. All transcripts were statistically significant (FDR < 1e-7) and ranked in the top 1% most positively or negatively enriched transcripts within at least one sample set. The heatmap color spectrum corresponds to percentile ranks, with under-expressed transcripts (blue) and over-expressed transcripts (red).
(b) Heatmap of cancer-specific lncRNAs nominated by SSEA Cancer vs. Normal analysis of 12 cancer types (columns). All transcripts were statistically significant (FDR < 1e-3) and ranked in the top 1% most positively or negatively enriched transcripts within at least one sample set.
(c) Scatter plots showing enrichment score for Cancer vs. Normal (x axis) and Cancer Lineage (y axis) for all lineage-specific and cancer-associated lncRNA transcripts across 12 cancer types. Red points indicate transcripts meeting the percentile cutoffs for cancer- and lineage-association.
(d) Boxplot comparing the performance of cancer- and lineage-associated lncRNAs across 12 cancer types. The average of the lineage and cancer versus normal ES is plotted on the y axis.
(e) Genomic view of chromosome 2q35 locus. Most zoomed view (bottom) depicts BRCAT49, a breast lineage and breast cancer specific lncRNA. Breast cancer associated GWAS SNP, rs13387042, is depicted in green.
(f) Expression data for BRCAT49 across all MiTranscriptome cancer and normal tissue type cohorts.
(g) Expression data for MEAT6 across all MiTranscriptome cancer and normal tissue type cohorts.

