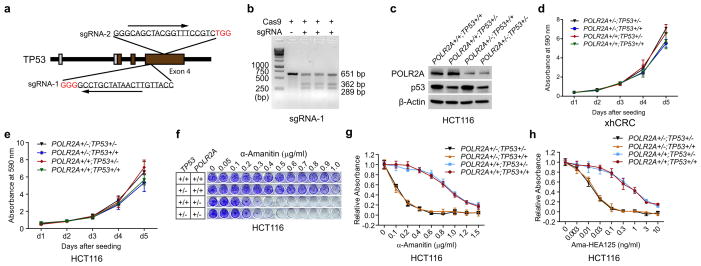
Extended Data Figure 6. Sensitivity of POLR2Aloss cells to POLR2A inhibition is independent of p53.
a, Schematic illustration of the Cas9/sgRNA-targeting sites in the TP53 gene. Two sgRNA-targeting sequences are shown and the PAM sequences are highlighted in red. b, Efficiency of the Cas9-mediated cleavage of TP53 in HCT116 cells measured by Surveyor assay. c, Protein levels of POLR2A and p53 in a panel of isogenic HCT116 cells. d, Growth curves of POLR2Aneutral and POLR2Aloss xhCRC cells. e, Growth curves of POLR2Aneutral and POLR2Aloss HCT116 cells. f, g, Crystal staining images (f) and cell survival curves (g) of POLR2Aneutral and POLR2Aloss HCT116 cells treated with α-Amanitin. h, Cell survival curves of POLR2Aneutral and POLR2Aloss HCT116 cells in response to the treatment of Ama-HEA125. Data are mean and s.d. of three independent experiments in the figure.

