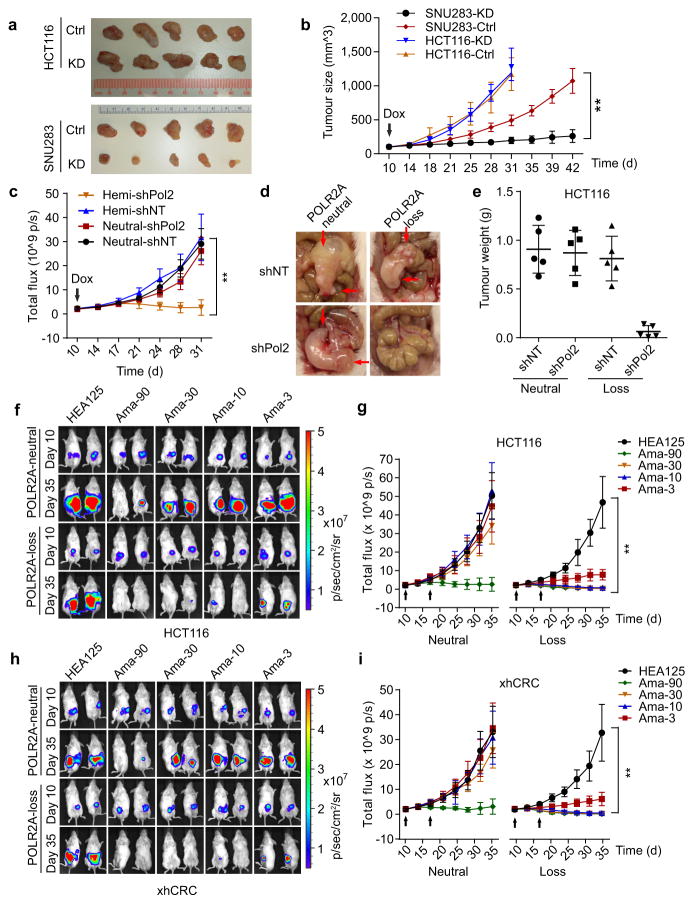
Figure 4. Suppression of POLR2A selectively inhibits the POLR2Aloss tumour growth.
a, b, Gross tumour images (a) and growth curves (b) of xenograft tumours derived from subcutaneously implanted HCT116 or SNU283 cells expressing control or Dox-inducible POLR2A shRNA. n = 5 mice per group. Error bars, s.e.m. c–e, Tumour growth curves (c, **p < 0.01, error bars, s.e.m.), gross tumour images (d) and weights (e, error bars, s.d.) of xenograft tumours derived from orthotopically implanted POLR2Aneutral and POLR2Aloss HCT116 cells expressing Dox-inducible control or POLR2A shRNA. n = 5 mice per group. f–i, Representative bioluminescent images (f, h)and tumour growth curves (g, i)of orthotopic xenograft tumours derived from POLR2Aneutral and POLR2Aloss HCT116 (f, g) or xhCRC cells (h, i) that received dual intraperitoneal injections of HEA125 antibody or Ama-HEA125 antibody-drug conjugate (3, 10, 30 and 90 μg kg−1). n = 10 mice per group. Error bars, s.e.m.

