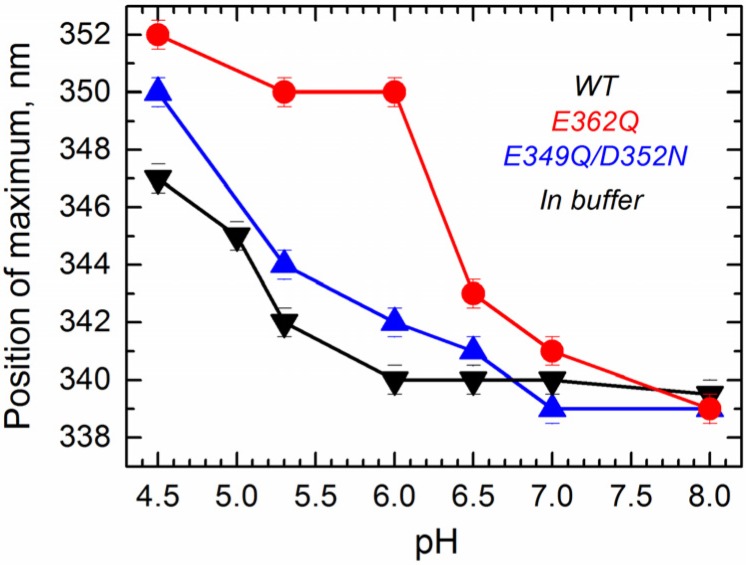
Figure 4.
Intrinsic fluorescence measurements in solution show that acidification causes a red-shift in the position of maximum emission in the WT T domain (black) and the mutants E362Q (red) and E349Q/D352N (blue), which is considerable larger for the mutant E362Q. Data correspond to the mean of three independent measurements. Error bars correspond to the instrumental error.

